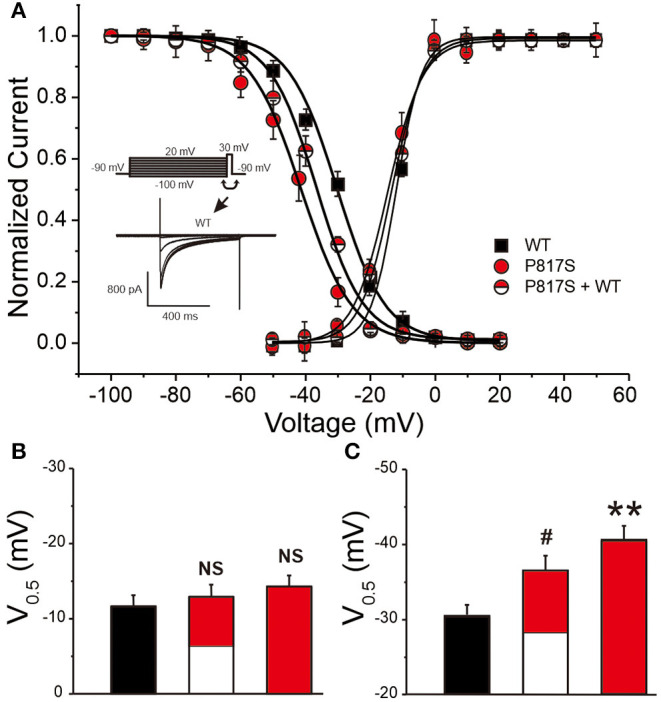
Figure 3.

The steady-state activation and inactivation of HEK293 cells expressing WT, P817S+WT, and P817S (n = 15, 10, and 11 for activation; n = 8, 10, and 7 for inactivation, respectively). (A) Normalized activation conductance and inactivation current, fitted to the Boltzmann equation. (B,C) Bar graph showing potential for half-maximal activation and inactivation of each group. NS (no significance), #p < 0.05, compared with P817S+WT. **p < 0.01, compared with P817S.
