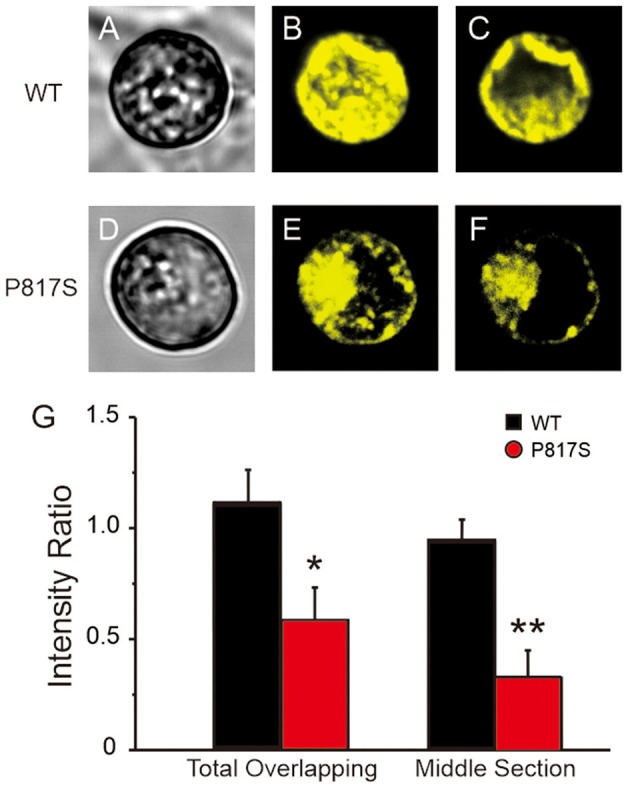
Figure 4.

Confocal fluorescence microscopic images of EYFP-tagged CaV1.2 channels in HEK293 cells expressing WT and P817S (n = 10 and 9, respectively). (A–F), Representative confocal XYZ scans showing localization of CaV1.2 channels. (A,D) Left, (B,E) middle, and (C,F) right photomicrographs show the light transmission images, total overlapping of phase contrast confocal images and middle section of phase contrast confocal images, respectively, for the same cell. (G) Bar graphs showing peripheral/central fluorescence intensity ratio of total overlapping and middle section. *p < 0.05, **p < 0.01, compared with P817S.
