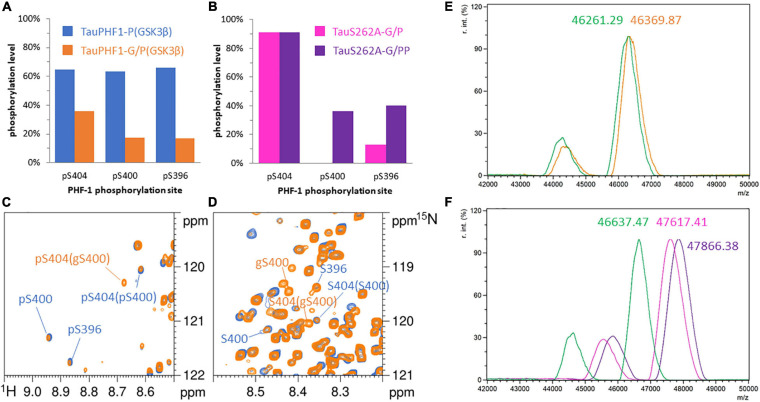
FIGURE 3.
Phosphorylation patterns of 15N-TauPHF1-G (A,C,D,E) by GSK3β without priming by CDK2 and 15N-TauS262A-G (B,F) by GSK3β with CDK2 priming. (A,B) Phosphorylation levels of the PHF-1 epitope. (A) TauPHF1 (blue bars) and TauPHF1-G (orange bars) phosphorylated by GSK3β. (B) TauS262A-G phosphorylated by CDK2 (pink bars) and GSK3β after CDK2 priming (purple bars). (C,D) 1H-15N HSQC spectra of TauPHF1 (blue) and TauPHF1-G (orange) phosphorylated by GSK3β without priming by CDK2 showing the resonances of PHF-1 residues corresponding to the phosphorylated state (C) and the non-phosphorylated state (D). Resonances related to the O-GlcNAcylated forms of S400 is indicated by “gS400”. (E,F) Mass spectrometry analyses of 15N-TauPHF1-G (E) before (green) and after GSK3β phosphorylation (orange) and 15N-TauS262A-G (F) before (green) and after CDK2 (pink) or CDK2/GSK3β (purple) phosphorylation.

