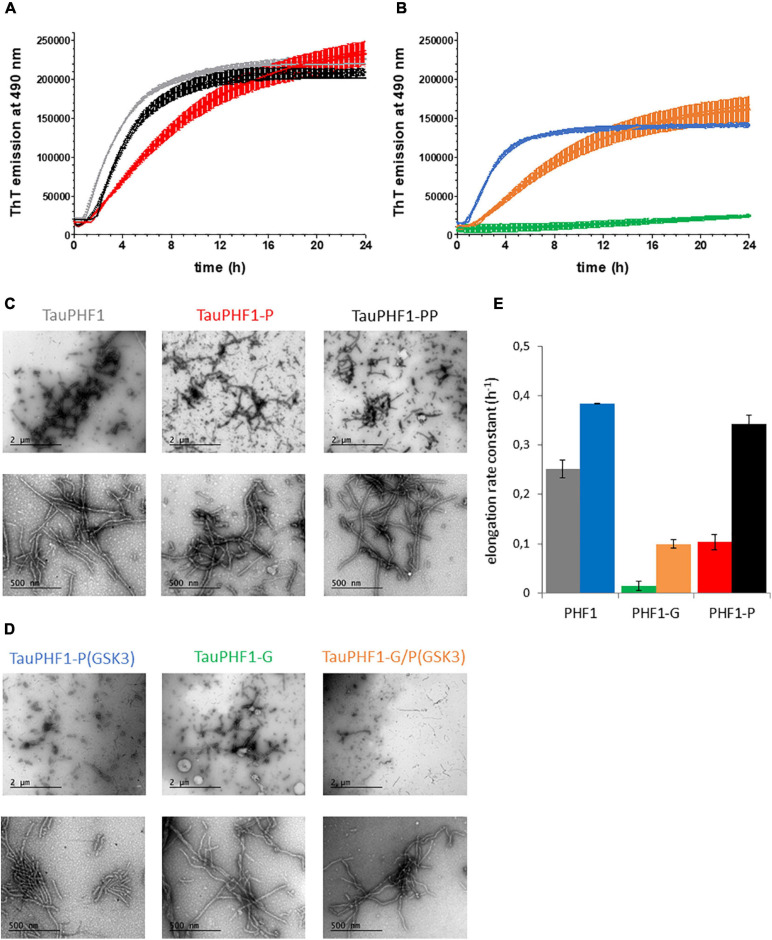
FIGURE 5.
Aggregation of TauPHF1 series induced by heparin. (A,B) Kinetics of TauPHF1 aggregation probed by ThT fluorescence emission plotted as mean ± standard deviation. (C,D) TEM images showing the fibril morphology of TauPHF1 isoforms with 20,000× (upper panels) and 85,000× (lower panels) magnification. The scale bars of the upper panels correspond to 2 μm and for the lower panels to 500 nm. Isoforms that are non-phosphorylated by GSK3β (Tau, Tau-G, and Tau-P) and phosphorylated by GSK3β (Tau-P(GSK3), Tau-G/P(GSK3), and Tau-PP) are depicted in (C) and (D), respectively. (E) Elongation rate constants calculated from curves fitted with a one-phase association model. The color coding is the same for all panels as indicated in (C) and (D) for the different TauPHF1 isoforms.

