FIGURE 6.
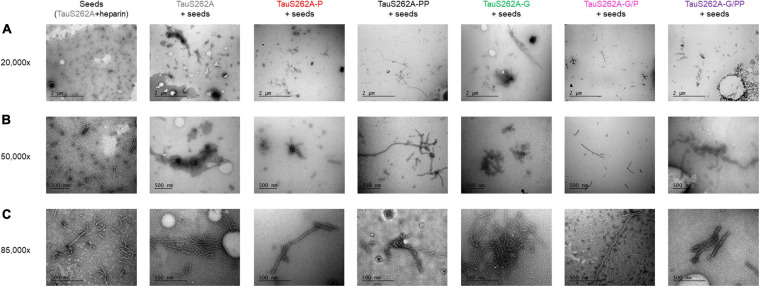
Transmission electron micrographs with negative staining of fibrillar aggregation of TauS262A protein series induced by Tau seeds prepared with TauS262A and heparin (ratio 4:1) for 7 days at 37°C, diluted 10-fold in 25 μM monomeric Tau (gray), Tau-P (red), Tau-PP (black), Tau-G (green), Tau-G/P (pink) and Tau-G/PP (purple) showing three different magnification: 20,000× (A), 50,000× (B) and 85,000× (C). The scale bar of 2 μm applies to panels (A), 500 nm to panels (B,C).

