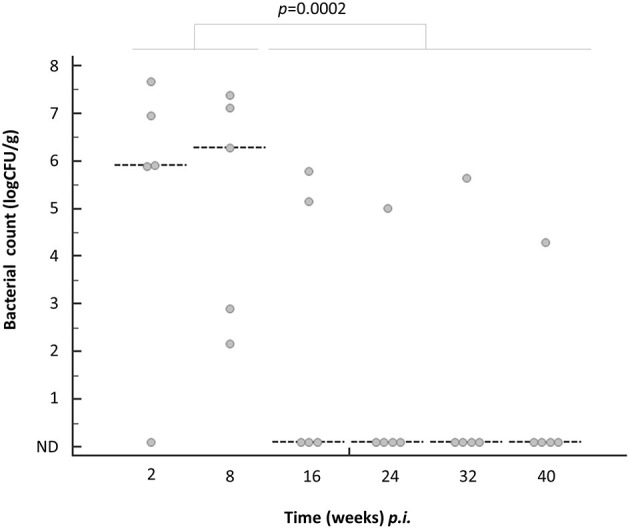
Figure 1.

Temporal colonization fitness of C. jejuni 81-176 in the caecum of laying hens. Each dot (gray) represents bacterial numbers detected per a gram of caecum. Dotted line represents median at each sampling time point. Statistical significance of the differences in the number of bacteria between the groups (2 and 8 weeks p.i. vs. 16–40 weeks p.i.) by Fisher's extract test.
