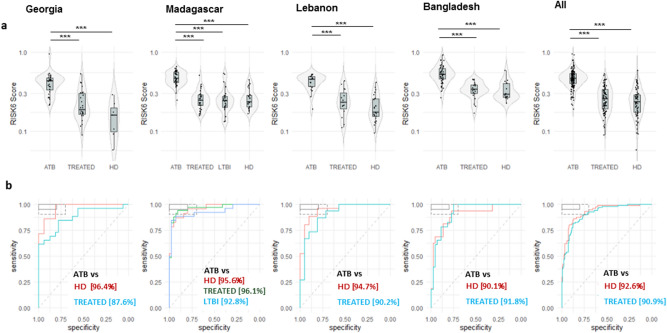
Figure 1.
Validation of the performance of a multi-cohort 6-gene signature; RISK6 as a screening and triage test in patients with pulmonary TB. (a) Violin plots showing the differences in the levels of RISK6 signature scores from patients with active TB at baseline (ATB, n = 141), treated TB patients (TREATED, n = 97; patients with a negative sputum culture at T2 and/or T3), individuals with a latent TB infection (LTBI, n = 26), and healthy donors (HD, n = 71) from Georgia, Madagascar, Lebanon, Bangladesh and in all sites. Horizontal lines designate medians, boxes represent the inter-quartile ranges (IQR) and the ranges are represented by whiskers. Single patient results are represented by each dot in the graph. Statistical significance was calculated using Mann–Whitney U test. *Indicates a p-value < 0.05, **indicates a p-value < 0.01, and ***indicates a p-value < 0.001. (b) Receiver operating characteristic (ROC) curve analysis and the respective areas under the curve (AUC) with 95% confidence intervals showing the performance of the RISK6 signature to discriminate between ATB patients at baseline, HD and LTBI. In the top left box, the solid and dashed lines represent the respective optimal and minimum criteria set by the WHO in the target product profile (TPP) for a screening/triage test for TB.

