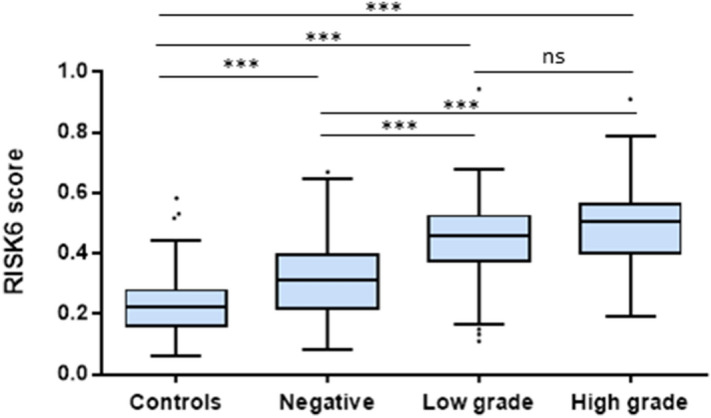
Figure 2.

Correlation between RISK6 signature scores and mycobacterial loads determined by sputum smear microscopy in ATB patients. Boxplots comparing the RISK6 score levels stratified according to sputum smear grade: Negative smears, low grade positive smears (1+ or scanty) and high grade positive smears (2+ or 3+). Horizontal lines designate medians, boxes represent the inter-quartile ranges (IQR) and the ranges are represented by whiskers. Individual dots represent the results of patients with a RISK6 scores out of IQR. Statistical significance was calculated using Mann–Whitney U test. Ns non-significant, ***indicates a p-value < 0.001. HD Healthy donors.
