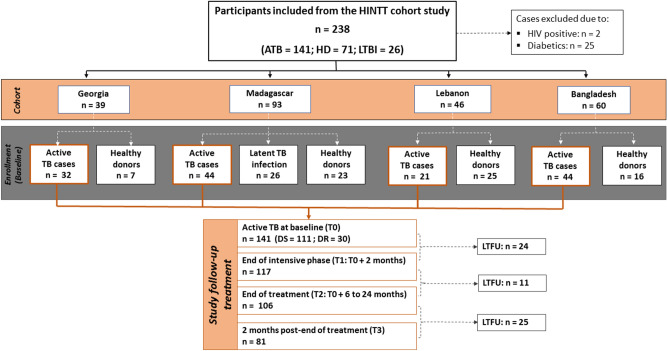
Figure 4.
Flow diagram describing the enrollment and exclusion of participants with active TB, latent TB infection, and healthy donor participants from the different cohorts. ATB patients were followed-up at four different time points: at baseline (T0), ATB patients who didn’t their TB treatment and followed throughout antibiotic therapy: at month 2 (T1), at the end of treatment (T2), and 2 months after treatment completion (T3). TB Tuberculosis, ATB active TB, LTBI Latent TB infection, HD healthy donors, HIV human immunodeficiency virus, DS drug-susceptible, DR drug-resistant, LTFU lost to follow-up.

