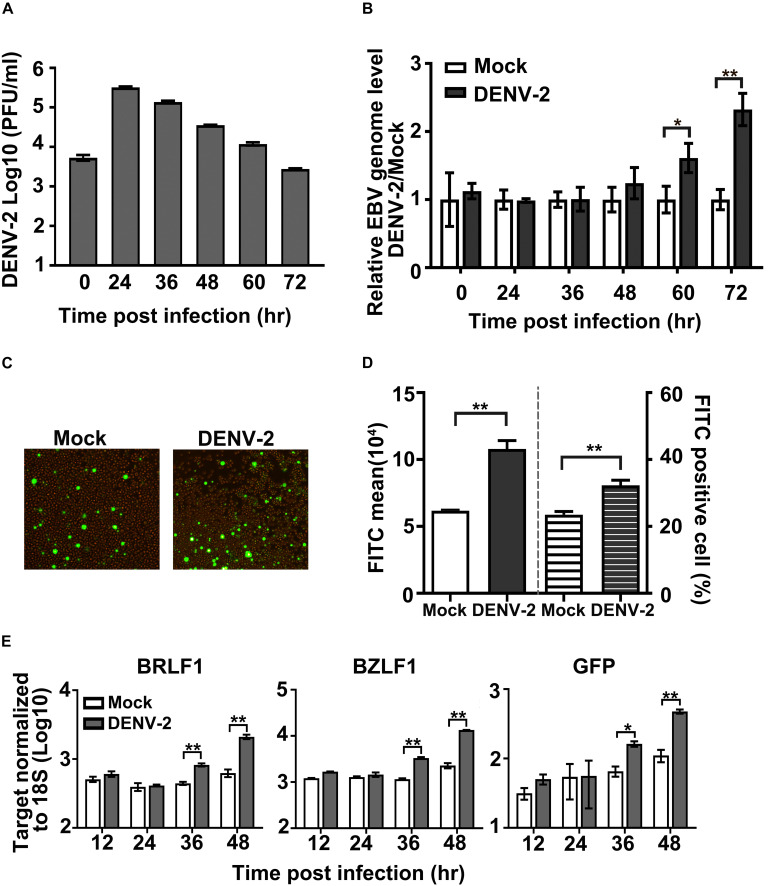
FIGURE 1.
Effect of DENV-2 infection on Epstein–Barr virus (EBV) reactivation in EBV + Akata cells. (A–E) EBV + Akata cells were mock-infected or infected with DENV-2 at a multiplicity of infection (MOI) of 10. At the indicated hour post-infection (hpi), DENV-2 titers in the culture medium were determined by plaque assay (A). Cell-associated EBV genome copy number was measured by qPCR and normalized to glyceraldehyde 3-phosphate dehydrogenase (GAPDH). DENV-2-infected groups were normalized to mock-infected group (set as 1) at all time points post-infection and plotted as in panel B. At 72 hpi, green fluorescent protein (GFP) level in mock or DENV-2-infected EBV + Akata cells was photographed under a fluorescence microscope (C) or quantified by flow cytometer (D). The empty and filled columns on the left half of the chart in panel D represented fluorescein isothiocyanate (FITC) mean value, and the striped columns on the right half represented the percentage of FITC-positive cells. mRNA level of BRLF1, BZLF1, and GFP at the indicated time points post-dengue infection was quantified by RT-qPCR, normalized to 18S rRNA, and plotted (E). p < 0.01 was marked as ** and p < 0.05 was marked as *.

