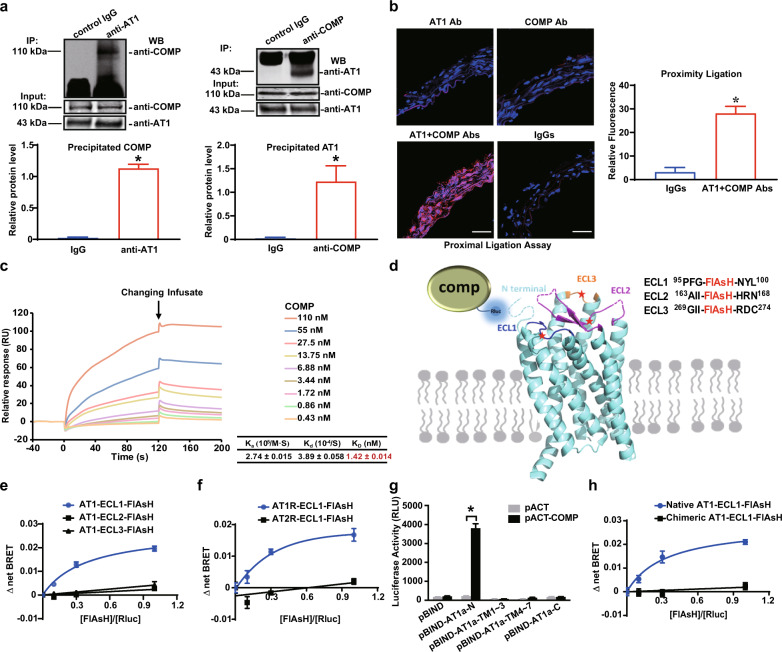
Fig. 4. COMP directly binds to the AT1 receptor.
a Co-IP assay with suprarenal aortas from C57BL/6 J mice. Left panel, vascular extracts were incubated with an anti-AT1 antibody or control IgG, followed by Protein A/G agarose beads. The COMP protein was examined using a western blot analysis. Right panel, vascular extracts were immunoprecipitated with an anti-COMP antibody or control IgG. The AT1 protein was then examined using a western blot analysis. Input was evaluated using aortic lysates before immunoprecipitation. n = 3; *P < 0.05 by the unpaired Student’s t-test. b Proximity ligation assay of AT1 receptor and COMP using specific antibodies on cross-sections of suprarenal aortas from 5-month-old male mice. n = 3; *P < 0.05 by the unpaired Student’s t-test. Scale bars, 50 μm. c SPR sensorgrams of the binding of an increasing amount of COMP to AT1 receptor captured on a CM5 chip. The increase in RUs from baseline was measured and used to calculate the binding kinetics, including association constant (Ka), dissociation constant (Kd) and affinity constant (KD) for COMP binding to immobilized AT1 receptor. d Structural representation of the AT1 receptor with a TC-tag (CCPGCC) inserted at corresponding sites in ECL1, ECL2 or ECL3 as AT1-FlAsH plasmids, which were further separately co-transfected with COMP-RLuc into HEK293T cells. e Saturation BRET signal between RLuc and FlAsH in HEK293T cells co-transfected with a fixed amount of COMP-RLuc plasmid and an increasing amount of AT1-ECL-FlAsH plasmids (n = 3). f Saturation BRET signal between RLuc and FlAsH in HEK293T cells co-transfected with a fixed amount of COMP-RLuc plasmid and an increasing amount of AT1-ECL1-FlAsH or AT2-ECL1-FlAsH plasmids (n = 3). g Mammalian two-hybrid analysis of the AT1–COMP interaction. COS-7 cells were transiently transfected with various domain constructs of AT1a receptor in the pBIND vector, together with COMP fused into the pACT vector. Cells were lysed after 48 h, and the luciferase activity was determined. The data are presented as the means ± SEM of 3 independent experiments performed in triplicate. *P < 0.05 by Two-way ANOVA followed by the Bonferroni test. h Saturation BRET signal between RLuc and FlAsH in HEK293T cells co-transfected with a fixed amount of COMP-RLuc plasmid and an increasing amount of AT1-ECL1-FlAsH or a chimeric AT1-ECL1-FlAsH with the alternative N-terminus from AT2 receptor (n = 3).

