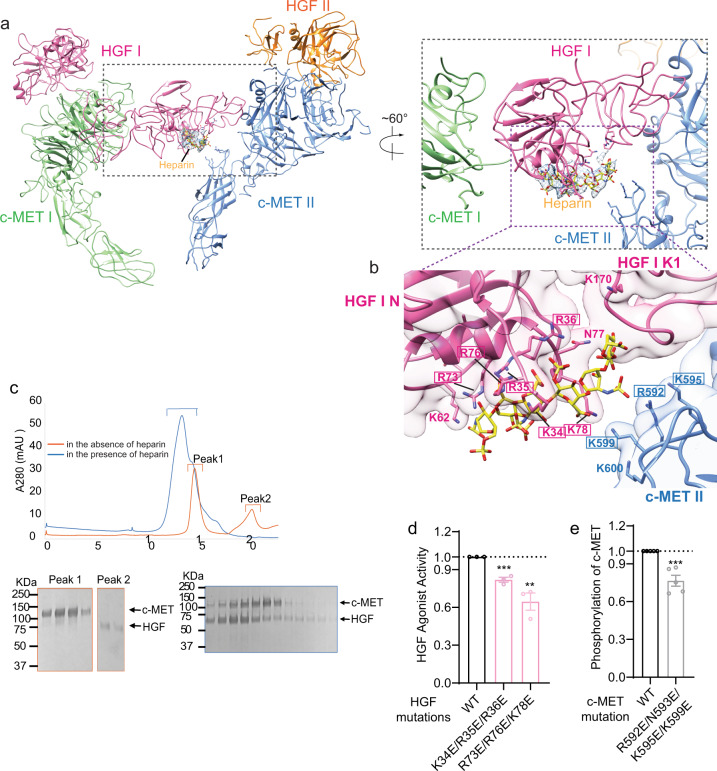
Fig. 4. Heparin strengthens the interaction between c-MET II and HGF I.
a Overview of the binding of heparin at c-MET/HGF holo-complex, shown in two different views. The location of the heparin-binding site is between the IPT1 domain of c-MET II and N domain of HGF I. b Close-up view of the heparin-binding between the c-MET II-IPT1 domain and the HGF I-N domain. The HGF and c-MET residues mutated for cell-based activity assays are indicated by rectangular boxes. c The representative SEC profiles of c-MET/HGF complexes in the absence (orange) or presence (blue) of heparin from N = 3 repeats. The stable c-MET/HGF complex is formed only when heparin is present. d The levels of c-MET autophosphorylation in response to HGF wild-type (WT) or indicated mutants that were expected to disrupt the binding between HGF and heparin. Mean ± SEM are from N = 3 independent biological repeats. The representative western blot data were shown in Supplementary Fig. 5. e HGF-induced c-MET autophosphorylation in H1299 cells expressing c-MET WT or indicated mutants that were expected to disrupt c-MET/heparin interaction. Mean ± SEM are from N = 5 independent biological repeats. The representative western blot data were shown in Supplementary Fig. 6. Statistical difference in d–e is analyzed using two-tailed Student’s t-test and P values were calculated between WT and mutants: ns, P > 0.05; *P ≤ 0.05; **P ≤ 0.01; ***P ≤ 0.001. Source data are provided as a Source Data file. Exact P values in d from left to right: 0.0007, 0.0068. Exact P value in e: 0.0006.

