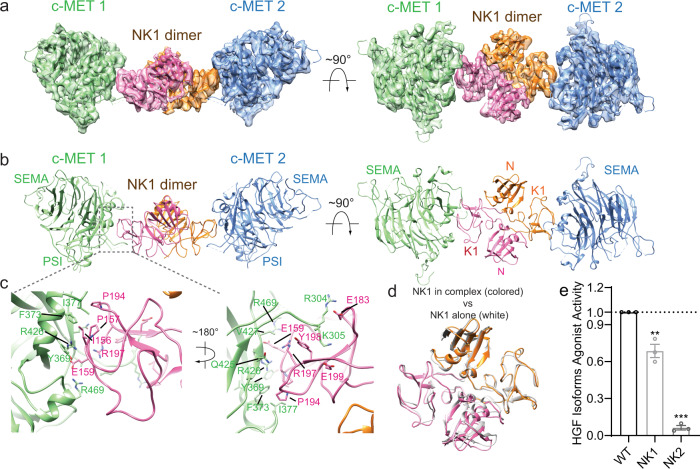
Fig. 6. Overall structure of the c-MET/NK1 complex.
a 3D reconstruction of the 2:2 c-MET/NK1 complex, and the corresponding ribbon representation of this complex fitted into the cryo-EM map at 5 Å resolution, shown in two orthogonal views. b The ribbon representation of the 2:2 c-MET/NK1 complex shown in two orthogonal views. c Close-up view of the interface between c-MET-SEMA and HGF-K1, showing in two views. d Superposition between free NK1 dimer (PDB ID: 1NK144; white) and NK1 dimer after binding c-MET (colored). e The levels of c-MET autophosphorylation in response to NK1 or NK2. Mean ± SEM are from N = 3 independent biological repeats. Statistical difference was analyzed using two-tailed Student’s t-test and P values were calculated between WT and mutants: **P ≤ 0.01; ***P ≤ 0.001. The representative western blot data were shown in Supplementary Fig. 5. Source data are provided as a Source Data file. Exact P values in e from left to right: 0.0043, <0.0001.

