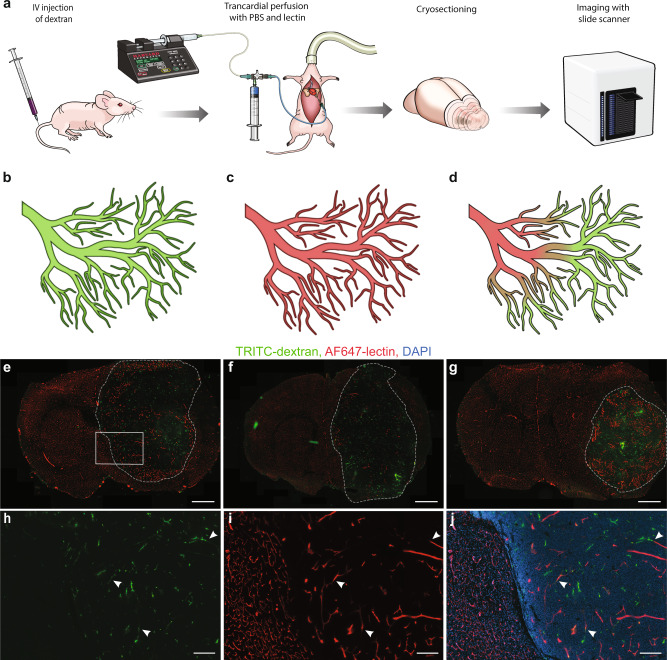
Fig. 2. Measurement of perfusion degree based on fluorescently labeled probes.
a Schematic representation of the experimental setup for studying the degree of transcardial perfusion. b Schematic representation of potential experimental outcomes including full vasculature coverage by TRITC-dextran in a situation with complete inefficiency of transcardial perfusion, c full vasculature coverage by AF647-lectin in a situation with successful transcardial perfusion, and d heterogeneous vasculature coverage by both AF647-lectin and TRITC-dextran in a situation with incomplete perfusion of varying degrees. e–g Representative images of coronal brain sections showing homogeneous AF647-lectin labeling of the vasculature in the tumor-free contralateral hemisphere and heterogeneous distribution of fluorescently labeled probes in the tumor area, illustrating an incomplete perfusion of the tumors arising from G01 (e), G06 (f), and U87 (g) cell lines. Scale bars, 1000 µm. Tumor borders are highlighted with dashed lines. h–j High-magnification images of the selected area in e. Several examples of transition zones are marked with arrows. Scale bars, 200 µm.

