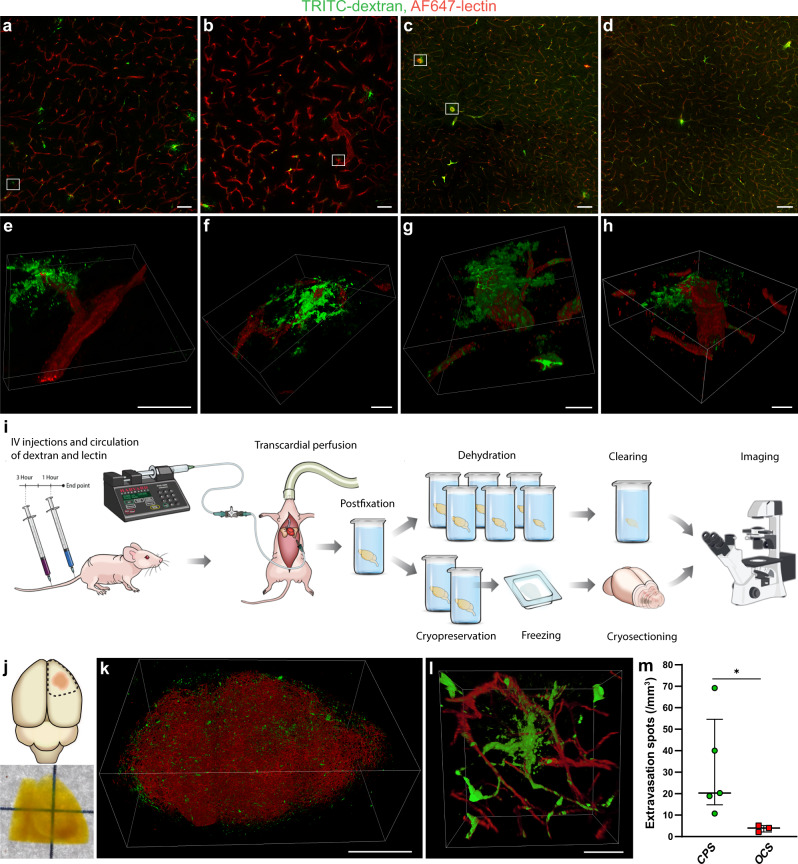
Fig. 4. Comparison of conventional sample preparation versus optical tissue clearing performance for the assessment of compound extravasation in GBM.
a, b Confocal images of TRITC-dextran extravasation in GBM. c, d Confocal images of TRITC-dextran extravasation in tumor-free brain regions. Scale bars, 100 µm. e, f 3D rendering of high-magnification confocal Z-stacks of the regions marked in a and b, illustrating extravasation spots being located in a close proximity to the sectioning-induced vessel disruption near the surface of tissue section. g, h 3D rendering of high-magnification confocal Z-stacks of the regions marked in c, illustrating the same phenomenon in normal brain vessels. Scale bars, 20 µm. i Schematic representation of the experimental setup employed to compare the performance of standard microscopy of conventionally prepared samples versus 3D deep microscopy of optically cleared samples for detection and quantification of compound extravasation in GBM. j Schematic depiction of the sample excision from the brain (top), and a bright-field image of the sample after clearing procedure (bottom). k 3D rendering of a GBM tumor in its full volume. Scale bar, 1000 µm. l 3D rendering of a high-magnification confocal Z-stack containing a TRITC-dextran extravasation spot arising from an intact tumor vessel. Scale bar, 50 µm. m Quantification of extravasation spots in G01 tumor samples, which were optically cleared (n = 3) or prepared conventionally (n = 5). Data are presented as median values of the estimates made by three researchers per tumor, bars represent medians with interquartile range (P = 0.035, Mann–Whitney test). CPS conventionally prepared samples, OCS optically cleared samples.

