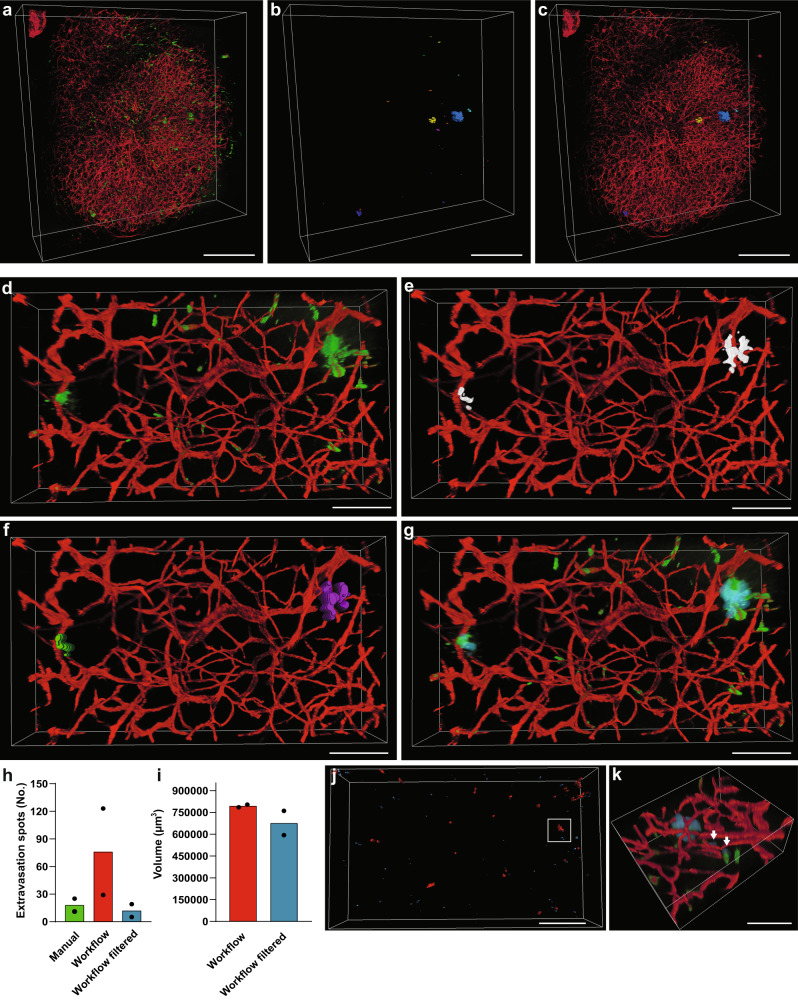
Fig. 5. A semiautomated machine learning-based workflow for detection and analysis of extravasation spots in 3D deep images.
a 3D rendering of a large data subset of a cleared tumor derived from an animal after IV injections of TRITC-dextran (green) and AF647-lectin (red). b Segmented and recognized TRITC-dextran extravasation spots from the dataset in a colored independently of any attributes. c Overlay of the original dataset with the segmented and recognized TRITC-dextran extravasation spots. Scale bars, 500 µm. d 3D rendering of tumor region containing dextran extravasation spots. e Extravasation spots in d segmented by trained machine learning algorithm. f Segmented extravasation spots in e after postprocessing steps recognized in Amira as separate “particles”. g Overlay of the original dataset with the segmented extravasation spots (in semitransparent cyan). Scale bars, 100 µm. h Quantification of extravasation spots by human annotator and the developed workflow before and after correction for PSF-artifact contribution. Data are presented as mean with individual dots representing individual samples. i Quantification of the total extravasation volume measured before and after correction for PSF-artifact contribution. Data are presented as mean with individual dots representing individual samples. j Recognized extravasation spots in one of the quantified samples (red spots > 10,000 µm3 and blue spots < 10,000 µm3). Scale bar, 500 µm. k High-magnification image of the region marked in j overlaid with the original data. Segmented extravasation spots are depicted in semitransparent blue. Arrows depict falsely recognized extravasation spots due to PSF-artifacts. Scale bar, 100 µm.

