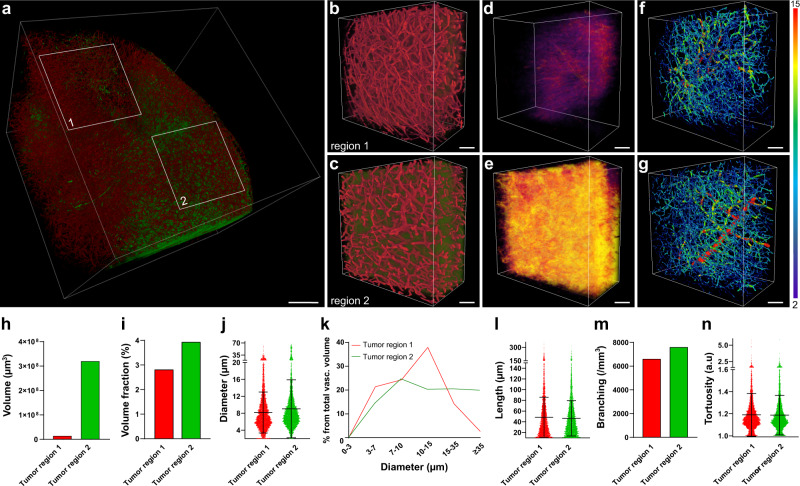
Fig. 7. Method application example: relationship between GBM vasculature permeability to TRITC-albumin and the angioarchitecture.
a 3D rendering of a large data subset derived from a cleared tumor dissected from an animal after IV injections of TRITC-albumin (green) and AF647-lectin (red). Scale bar, 500 µm. b, c 3D rendering of the regions marked in a in higher magnification. d, e TRITC-albumin extravasation segmented by thresholding after subtraction of the segmented vasculature in the tissue subsets in b and c, the colormap reflects the density of the pixels in the extravasation mask. f, g Traced vasculature from the subsets in b and c colored according to the vessel diameter, numbers for minimum and maximum vessel diameter are presented in µm. Scale bars, 100 µm. h Total volume of extravasation in the tissue subsets. i Vascular volume fraction in the tissue subsets. j Mean diameter of the vascular segments in tissue subsets. Data are presented as mean ± SD (n = 4804 and 5387 individual vessel segments). k Histogram representing the volume fraction occupied by vessels of a certain diameter from the total vascular volume fraction in the tissue subsets. l Mean length of the vascular segments in the tissue subsets. Data are presented as mean ± SD (n = 4804 and 5387 individual vessel segments). m Number of branching points per volume in the tissue subsets. n Mean tortuosity of the vasculature in the tissue subsets. Data are presented as mean ± SD, (n = 4804 and 5387 individual vessel segments).

