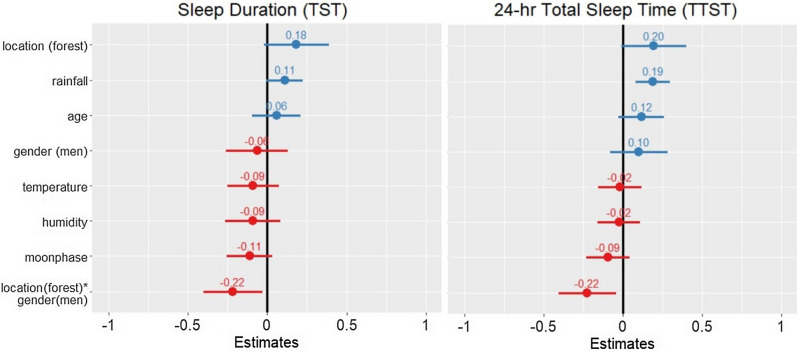
Figure 1.
Two fixed effect plots of ecological predictors on sleep duration quotas: nighttime sleep duration (TST) (left) and 24-h total sleep time (TTST) (right). Reference variables are set as village for location, and women for gender for all models. Both plots illustrate positive (indicated in blue) and negative (indicated in red) predictors of TST and TTST. The plotted lines indicate 95% confidence intervals of each predictor variable. For TST, only the location * gender interaction was a significant predictor variable. The location * gender interaction was also a negative predictor of TTST, while rainfall was a positive predictor. Values written above each plotted line are standard estimates of each predictor. Continuous predictors were scaled for comparability of the coefficients in the models.

