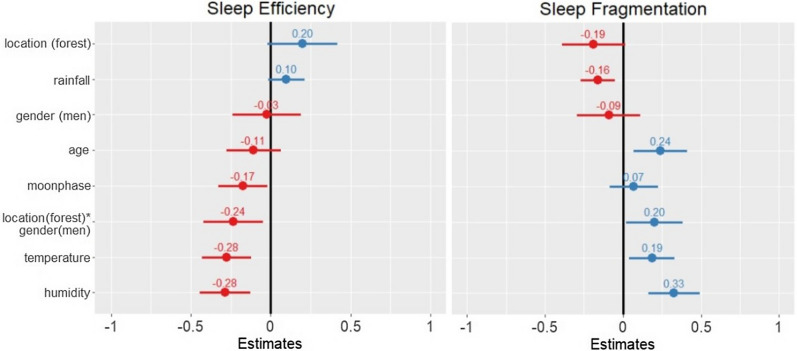
Figure 2.
Two fixed effect plots of ecological predictors on sleep quality measures: sleep efficiency (left) and Sleep fragmentation (right). For both plots, positive predictors on sleep quality are indicated in blue, while negative predictors are indicated in red. Values written above each confidence line are standard estimates of each variable. The plot on the left illustrates that humidity, temperature, moon phase, and the location * gender interaction effect all negatively influenced sleep efficiency in the BaYaka. The plot on the right illustrates that rainfall negatively influenced sleep fragmentation, while humidity, temperature, age, and the location * gender interaction effect were positive predictors of sleep fragmentation.

