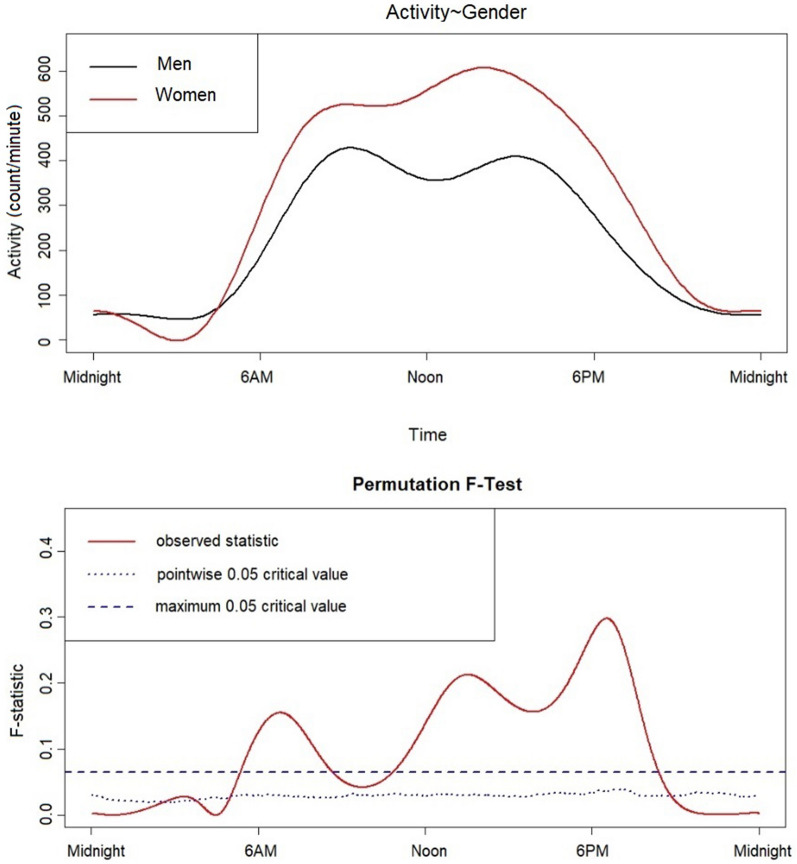
Figure 3.
Functional linear modelling comparing 24-h sleep–wake patterns of BaYaka men and women. Women are represented by a red line and men represented by a black line. Women displayed a sharp, steady incline of activity in the morning and generally higher levels of mean activity throughout the day as compared to men, especially in the afternoon. Men show a decline in their activity towards noon, suggestive of resting and/or napping periods before the next peak of activity, and a steady decline throughout the evening. The bottom panel displays a permutation F test; the point-wise critical value (dotted line) displays the proportion of permutation F values at the significance level of 0.05 for every time point. Men and women have significantly different mean circadian activity patterns at the points when the observed F-statistic (represented as a solid line) crosses the critical value (dotted line).

