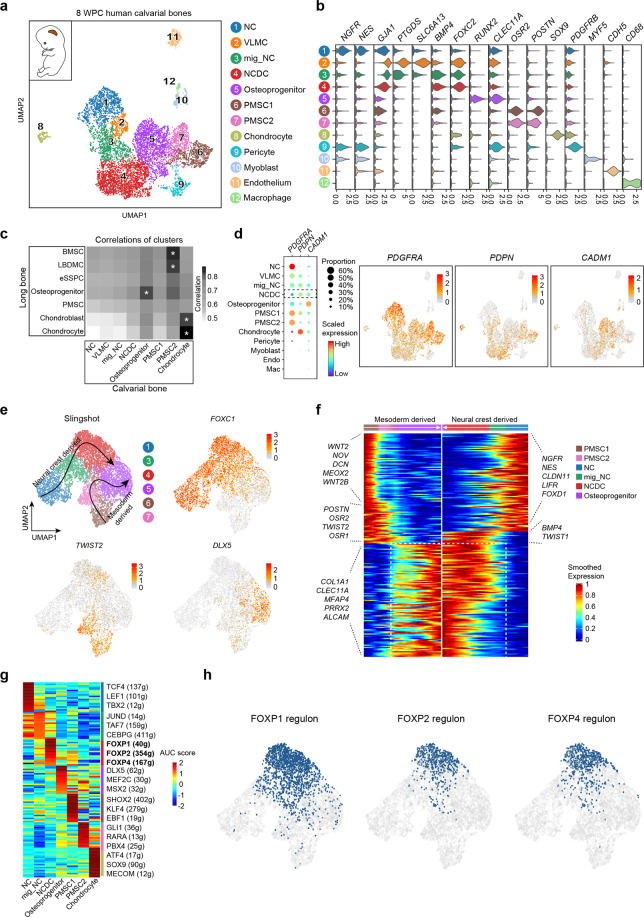
Fig. 6. Characterization of the osteogenic lineages in human embryonic calvaria identified neural crest-derived skeletal progenitors.
a UMAP visualization of 12 subsets in 8 WPC calvarial bones (n = 2 embryos). Inset illustrated the position of calvarial bone. b Violin plots showing the expression of feature genes for each subset. c Heatmap showing the transcriptome correlation between osteogenic subsets in calvarial and OCLC subsets in long bone. Asterisks indicated subsets with correlation coefficients > 0.8. d Dot plots (left) and UMAP plots (right) showing the expression of eSSPC marker genes in 12 subsets of 8 WPC calvarial. e UMAP visualization of the two osteogenic trajectories simulated by Slingshot across NC, mig_NC, NCDC, osteoprogenitor, PMSC1 and PMSC2 subsets (Upper left). Expression UMAP plots of marker genes (NC, FOXC1; Mesoderm, TWIST2; Osteoprogenitor, DLX5). f Heatmap of the gene expressions (smoothed over 20 adjacent cells) in subsets ordered by pseudotime of osteogenesis as in e. Top 200 genes were selected according to the P values of GVM test and representative genes were shown. Shared genes in two trajectories were indicated in dashed box. g Heatmap showing the AUC scores of regulons enriched in the osteogenic subsets. Z-score (row scaling) was computed. Representative regulons were shown on the right. h Binary activities of FOXP1/2/4 regulons were shown by UMAP plots.

