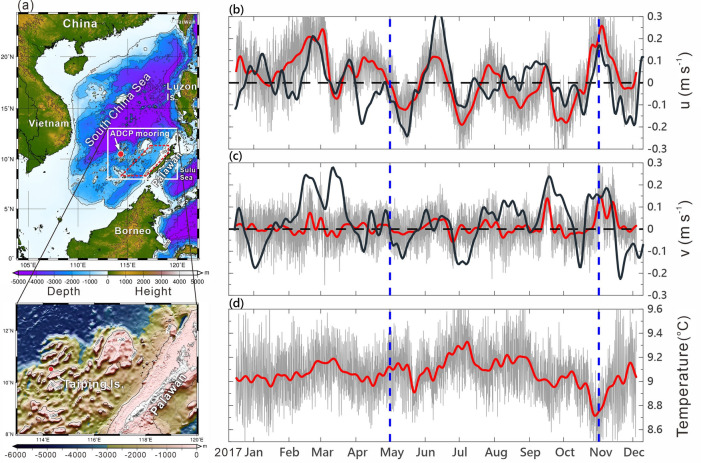
Figure 1.
Bathymetry of the SCS and the moored ADCP observed velocity and temperature. (a) Bathymetric chart of the SCS and an enlarged bathymetry in the lower panel showing the topography around the mooring. The filled red circle in both panels indicates the mooring location. (b,c) Components of the depth-averaged (40–120 m) velocity (gray curves). The 8.33-day low-pass-filtered, satellite altimeter data derived geostrophic currents (black curves) are overlaid on (b,c). The polygon area enclosed by the red dashed lines in (a) is for the area average of satellite SLA, wind stress, and wind stress curl. (d) Raw temperature at 480 m (gray curve). The depth-averaged velocity and raw temperature data are 8.33-day low-pass filtered (red curves).

