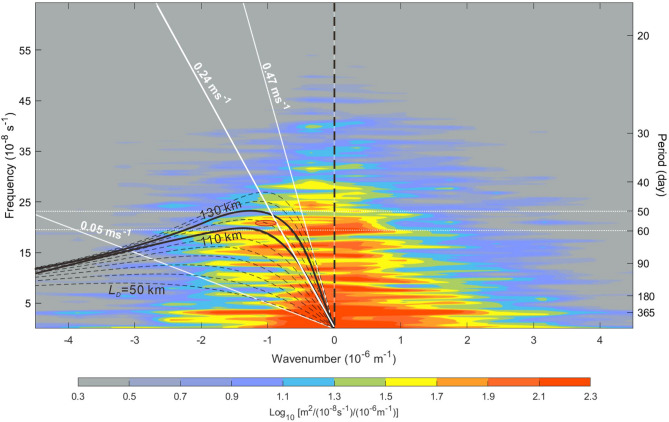
Figure 4.
Frequency-wavenumber spectrum of satellite SLA. The frequency-wavenumber spectrum was calculated from a 17-year (2001–2017) satellite SLA dataset. The black dashed curves represent dispersion relations of Rossby waves calculated using the dispersion relation of Rossby wave at baroclinic Rossby deformation radius LD from 50 to 150 km with an increment of 10 km. The two black thick curves mark dispersion relations at LD = 110 and 130 km. The oblique white lines indicate phase speed of 0.05, 0.24, and 0.47 m s–1. The color shading indicates the energy density of the SLA oscillations. The red oval indicates westward-propagating energy density hump within periods 50 and 60 days.

