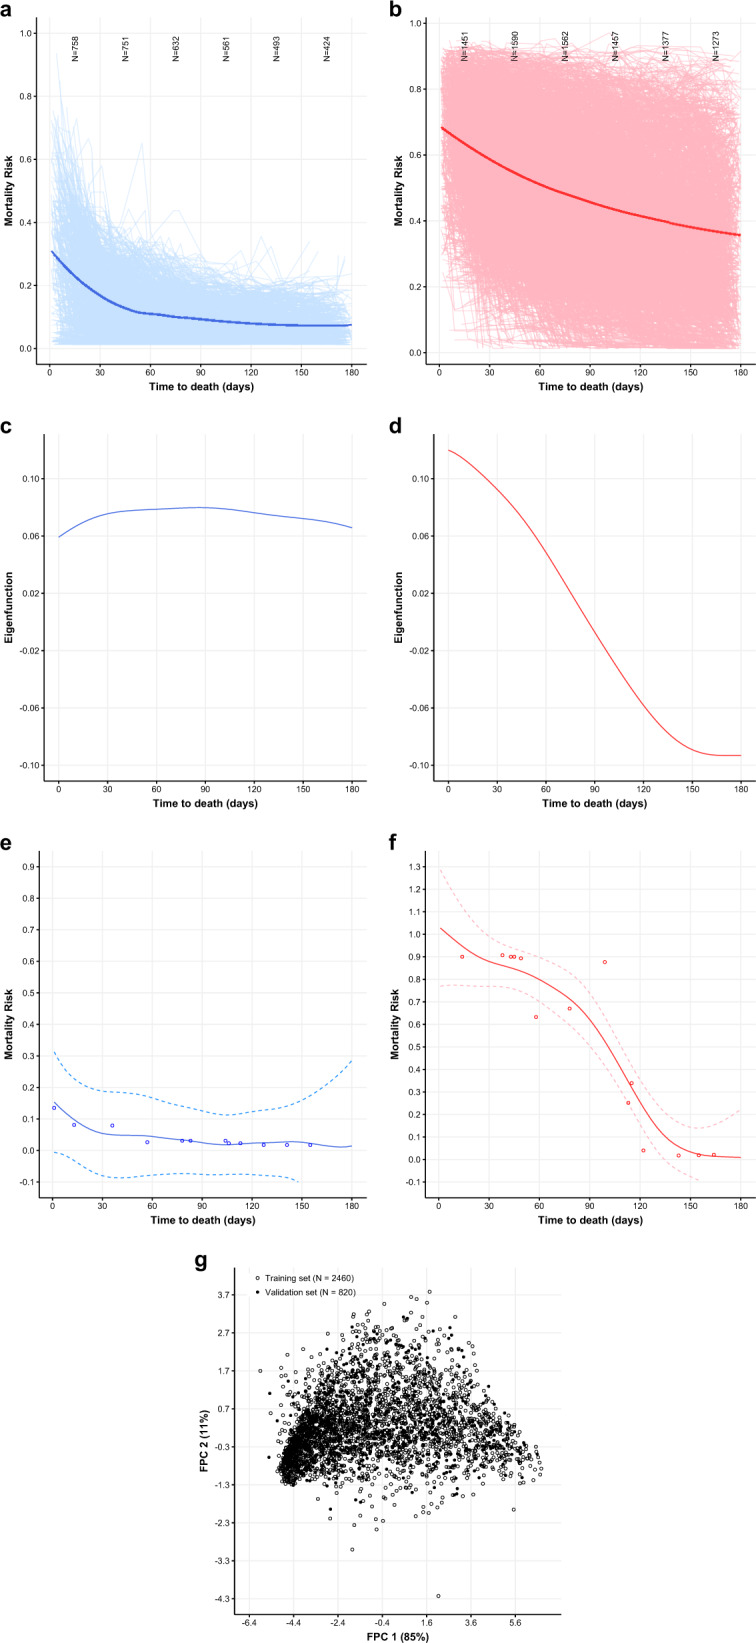
Fig. 1. Dominant modes of variation of trajectories of mortality risk.

a First (unpredictable) trajectory derived from FPCA. Smoothed estimate of the mean function for mortality risk scores from local weighted regression (loess) method (blue smoothed line), superimposed on the individual trajectories for all patients in this FPC (blue spaghetti plot). b Second (predictable) trajectory derived from FPCA. Smoothed estimate of the mean function for mortality risk scores from local weighted regression (loess) method (red smoothed line), superimposed on the individual trajectories for all patients in this FPC (red spaghetti plot). c Smoothed estimates of the first eigenfunction from FPCA (blue line), representing the first mode of variation from the “unpredictable” trajectory that explains 84.1% of total variation. d Smoothed estimates of the second eigenfunction from FPCA (red line), representing the second mode of variation from the “predictable” trajectory that explains 11.5% of total variation. e The individual patient with largest absolute value of the projection on the first eigenfunction (among the unpredictable trajectory) who had ≥10 encounters. Mortality risks (blue circles), predicted trajectories (blue solid lines), 95% simultaneous bands (dashed blue lines). f The individual patient with the largest absolute value of projection on the second eigenfunction (among the predictable trajectory) who had ≥10 encounters. Mortality risks (red circles), predicted trajectories (red solid lines), 95% simultaneous bands (dashed red lines). g Plotting FPC 1 (x axis) against FPC 2 (y axis) for the training set (empty circles) and validation set (filled circles). Both pairs of FPCs explain above 95% of the total variation in each set.
