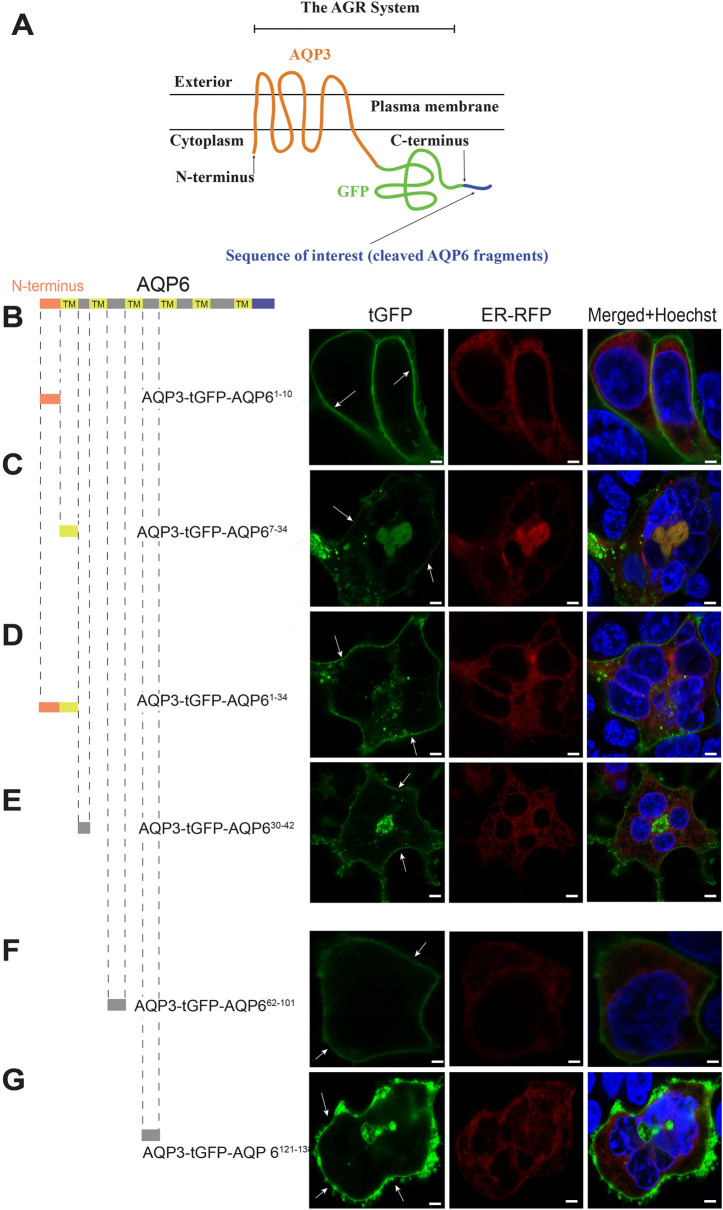
Figure 2.
AGR scanning of the first half of AQP6. (A) Schematic representation for usage of the AGR system with AQP6 (Figure was adapted from Ref.17) under the terms of the Creative Commons CC BY license. (B) Attaching the N-terminus of AQP6 (comprising residues AQP61–10) C-terminally to AGR, results in a construct that reaches the PM (white arrows). (C) In a similar manner, when the first transmembrane domain (TMD) of AQP6 (comprising residues AQP67–34) is C-terminally attached to AGR, this construct also reaches the PM. (D) Using the entire AQP61–34 residues (which include N-terminus and first TMD), instead of the subunits indicated in (A, B), also results in PM expression when attached to AGR. (E) When residues AQP630–42 are used, this construct also localized to the PM. (F) Similarly, when peptide residues AQP662–101 are attached to AGR, the construct localized to the PM. Finally, (G) when AQP6121–138 peptide residues are used the construct also reached the PM. Cells were observed microscopically using an upright Olympus BX51WI equipped with 100 × 1 NA objective and images were captured using a Grasshopper3 CMOS camera (FLIR, Richmond, BC, Canada) controlled by Leica LAS X version 3.5 software (available at: https://www.leica-microsystems.com/products/microscope-software/p/leica-las-x-ls/). All figures were created using Adobe Illustrator CS6 (Available at: https://adobe.com/products/illustrator), under an Adobe Inc., Creative Cloud Desktop 2019 shared device license to Case Western Reserve University (CWRU) that operates until 3/31/2022. Scale bars: 8 µm.

