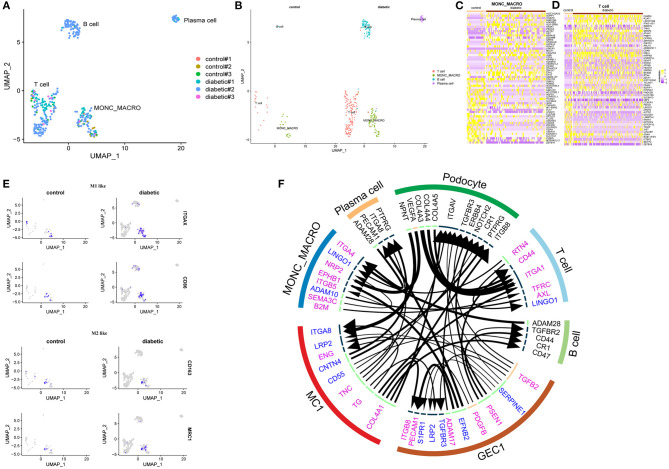
Figure 2.
(A) UMAP plot of the distribution of immune cells in different samples. (B) UMAP plot of four subclusters of immune cells. (C) Heatmap of top 30 up- and down-regulated DEGs in monocytes/macrophages. (D) Heatmap of top 30 up- and down-regulated DEGs in T lymphocytes. (E) Distribution of selected cell markers of monocyte/macrophage: (Upper) Presence of M1-like macrophage markers (ITGAX and CD86) and (Lower) M2-like macrophage markers (CD163 and MRC1). (F) Ligand-receptor interactions prediction network with DEGs from GEC1, MC1, monocytes/macrophages (MONO_MACRO), T lymphocytes, and top 500 expressed genes of podocytes, B lymphocytes, and plasma cells. In the circus, upregulated genes are labeled purple; downregulated genes labeled blue; top expressed genes in podocytes, B lymphocytes and plasma cells labeled black. The lines and arrowheads inside are scaled to indicate the correlations of the ligand and receptor. P-value < 0.05 were considered statistically different.

