FIGURE 2.
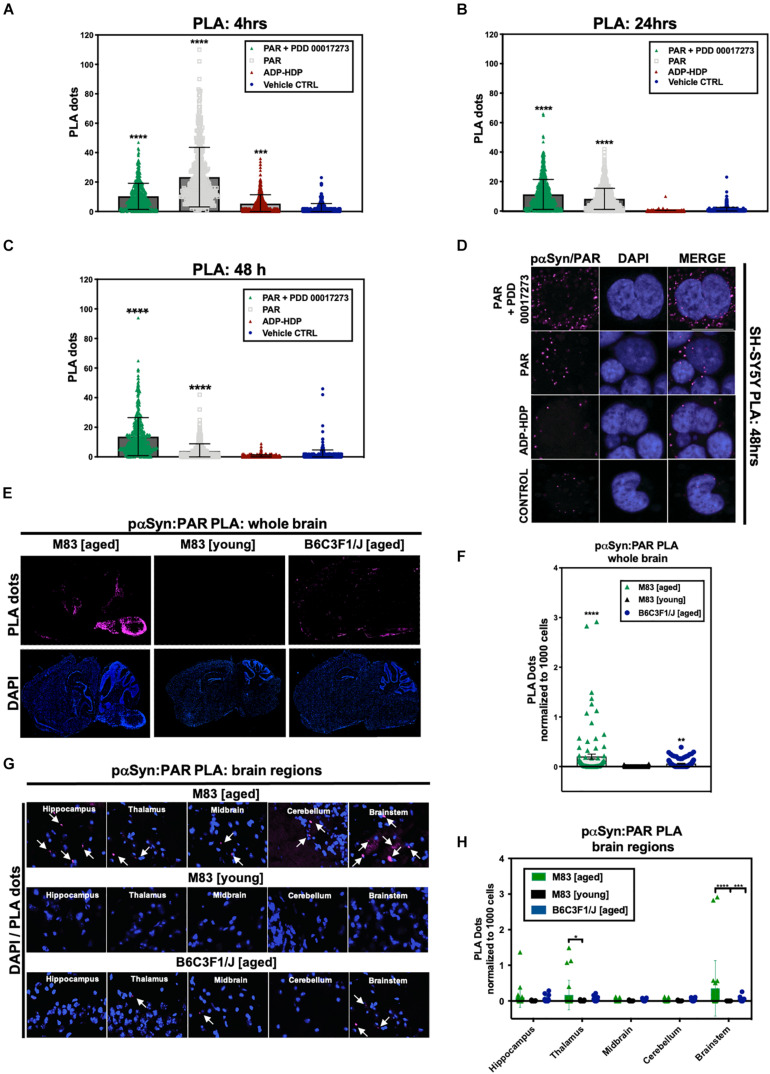
Poly (ADP-ribose) interacts with phosphorylated (S129) αSyn in pathological settings. Quantification from proximity ligation assays (PLA) measuring pαSyn and PAR interactions in SH-SY5Y-αSyn cells at (A) 4 h, (B) 24 h, and (C) 48 h post treatment with either PAR, PAR + 1 μM PDD00017273 (PARGi) or ADP-HDP vs. BioPORTER alone (vehicle control). Bars represent means ± SD. One-way ANOVA followed by Tukey’s post hoc test (n = 3). ***P < 0.0004, ****P < 0.0001 (D) Representative DAPI and PLA ROI images showing PLA dots (pink); these dots indicate direct interactions between pαSyn and PAR in PAR treated, ADP-HDP treated and BioPORTER alone (vehicle control) samples at 48 h. Scale bar 10 μm. (E) Representative DAPI (bottom panel) and PLA (top panel) whole brain images from M83 Tg aged, M83 Tg young, and B6C3F1/J aged mice. (F) Quantification of whole brain PLA levels in M83 Tg aged, M83 Tg young and B6C3F1/J mice (n = 3 per group). Each bar represents means ± SD. One-way ANOVA. **P < 0.002, ****P < 0.0001. (G) Representative PLA staining (white arrows) of ROIs obtained from 20× merge images. (H) Quantification of different brain regions in M83 Tg aged, M83 Tg young, and B6C3F1/J aged mice. Images were captured using Zeiss Axio Widefield (20×/0.8) microscope. Bars represent means ± SD. Two-way ANOVA followed by Tukey’s post hoc test (n = 3). *P < 0.025, ***P < 0.0002, ****P < 0.0001.

