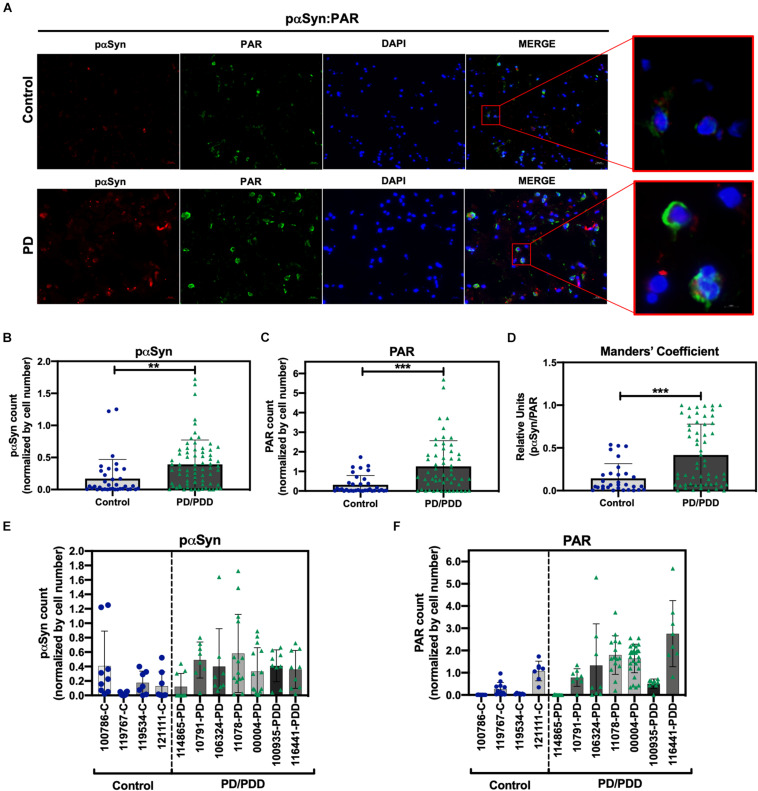
FIGURE 3.
Increased S129 pαSyn and PAR levels in PD/PDD patient samples. (A) Representative IF immunostain of pαSyn (red), PAR (green), and DAPI (blue) in non-PD control (top panel, tissue ID 121111, middle frontal gyrus) and PD/PDD (bottom panel, tissue ID 116441, middle frontal gyrus) patient samples. Merge channel regions of interest (ROI) show colocalization between pαSyn and PAR staining. Scale bar 20 μm. Images were captured using Zeiss Axio Widefield (20×/0.8) microscope. (B) Quantification of pαSyn levels, normalized by DAPI count, in control vs. PD/PDD patients. (C) Quantification of PAR levels, normalized by DAPI count, in control vs. PD/PDD patients. (D) Quantification of pαSyn/PAR overlap in control vs. PD/PDD patients using Manders’ overlap coefficient. Graphical symbols represent fields-of-view containing 100–150 cells each. Immunostain quantification of (E) pαSyn and (F) PAR expression for all human PD/PDD and non-PD post mortem brain samples used in this study. For all experiments, bars represent means ± SD. Student’s two-tailed t-test [n = 4 (control) and 7 (PD/PDD) patient samples per group]. **P < 0.0028, ***P < 0.0001. Graphical symbols represent fields-of-view containing 100–150 cells each.

