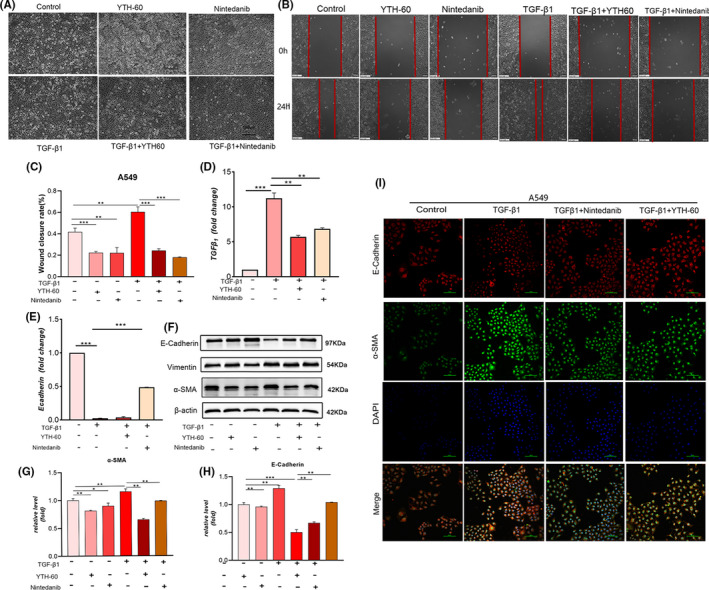
FIGURE 4.

YTH‐60 blocks TGF‐β1 induced EMT in A549 cells. A, The morphological changes were imaged using phase contrast microscopy. B, A549 cells were seeded in a 6‐well plate for 24 h, then starved with serum‐free medium for 6 h, and the medium was replaced with 5 ng·mL−1 TGF‐β1 fresh medium. A scratch was made using a sterile 200 μL micropipette tip. One hour later, 5 μmol·L−1 YTH‐60 was added. After 24 h, the cells were photographed by a microscope (Scale bar = 100 μm). C, Healing rate (%) = (wound area at 24 h/wound area at 0 h) × 100% (Scale bar = 100 μm). Data are presented as mean ± SD, n = 3, *P < .05; **P < .01 and ***P < .001, Scale bar = 100 μm. D, E, Quantitative real‐time qPCR analysis was used to measure the mRNA levels of E‐cadherin and TGF‐β1 in A549 cells stimulated with TGF‐β1 followed by 5 μmol·L−1 YTH‐60 administration for 24 h. F, Expression changes of α‐SMA, E‐cadherin and vimentin using western blot in A549 cells. G, H, Analysed by densitometry. Data are presented as mean ± SD, n = 3, *P < .05; **P < 0.01 and ***P < .001. I, The levels of E‐cadherin and α‐SMA were evaluated by immunofluorescence experiment. Scale bar = 100 μm
