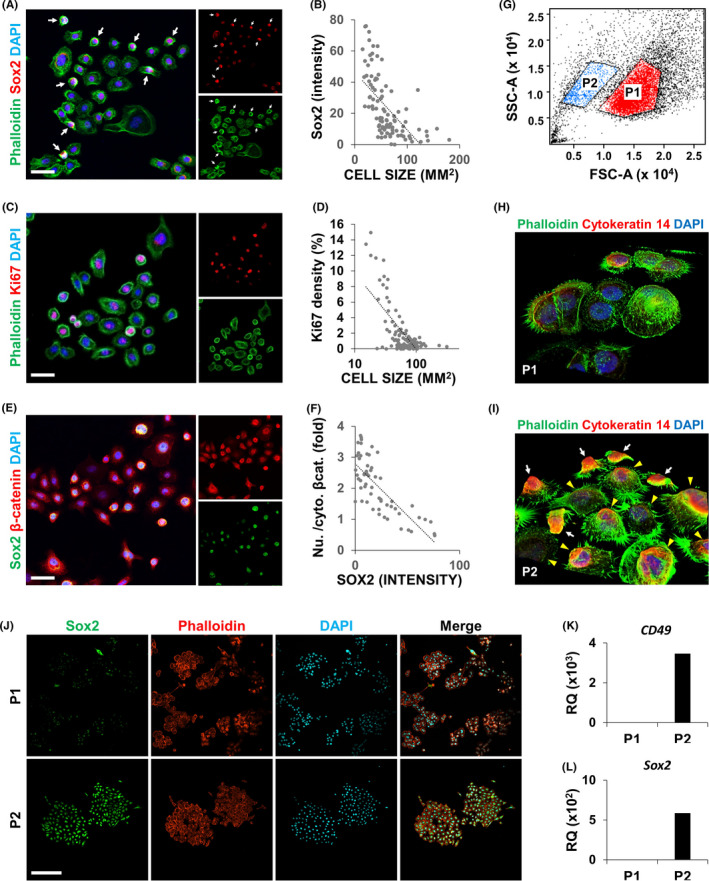
FIGURE 1.

AM‐1 harbours a cancer stem cell‐like population. A‐F, AM‐1 cells were subjected to immunocytochemistry (ICC) using antibodies to Sox2 (A, E), Ki67 (B), or β‐catenin (E). Small round cells strongly expressing Sox2 are indicated by white arrows (A). The cell size (B, D), Sox2 intensity (B, F), or ratio of nuclear to cytosolic β‐catenin (F) of each cell were measured and are displayed as a dot plot. A trend line (dotted line) shows the relationship between the measured factors (B, D and F). Cytoskeletons (A and C) and nuclei (A, C and E) were visualized using Alexa 488‐conjugated phalloidin (green) and DAPI (blue), respectively. Scale bar = 20 μm. G‐J, Scattered light characteristics of AM‐1 cells based on forward scattered light (FSC) and side scattered light (SSC). AM‐1 cells were sorted into two groups (P1 and P2) based on FSC and SSC (G) and cultured for 1 (H, I) or 3 d (J). Three dimensionally reconstructed image (H, I) and conventional confocal image (J). The cells were subjected to ICC using an antibody to Cytokeratin 14 and Sox2 (H‐J). Cytoskeletons and nuclei (H‐J) were visualized using fluorophore‐conjugated phalloidin and DAPI (blue), respectively. Scale bar = 100 μm. K‐L, Total RNA of AM‐1 cells in P1 and P2 were extracted and subjected to real‐time PCR analyses using primer sets of CD49f (K) and Sox2 (L). RQ, relative quantity. n = 3
