FIGURE 1.

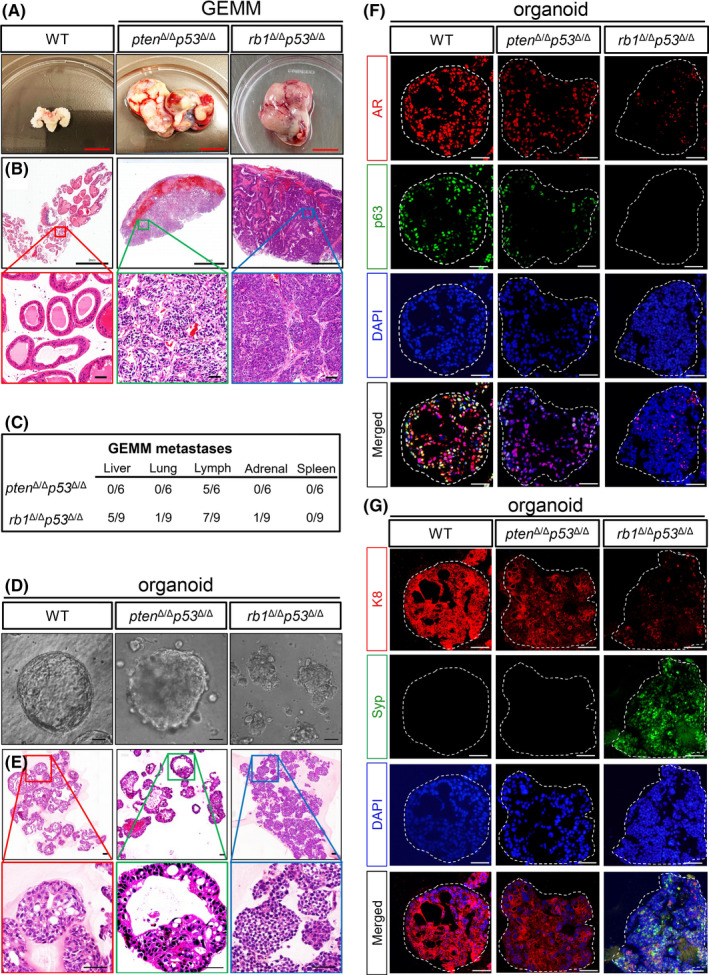
Generation of two lines of organoids from ptenΔ/Δp53Δ/Δ GEMM and rb1Δ/Δp53Δ/Δ GEMM mice. A, Representative bright‐field images of the end stage prostate tumors from the ptenΔ/Δp53Δ/Δ GEMM (middle) and rb1Δ/Δp53Δ/Δ GEMM (right) mice, respectively. An age‐matched prostate with seminal vesicles from a WT C57BL/6 mouse is shown as a control (left). Scale bar = 1 cm. B, Hematoxylin and eosin (H&E) staining of tissue sections from WT prostate, ptenΔ/Δp53Δ/Δ GEMM and rb1Δ/Δp53Δ/Δ GEMM primary prostate tumors. Upper panel, scale bar = 2 mm. Lower panel, scale bar =50 μm. C, Quantifications of the penetrance of PCa metastasis in the ptenΔ/Δp53Δ/Δ GEMM (n = 6) and rb1Δ/Δp53Δ/Δ GEMM (n = 9) mice. D, Phase contrast images of organoids from WT prostate (left), ptenΔ/Δp53Δ/Δ GEMM (middle) and rb1Δ/Δp53Δ/Δ GEMM (right) prostate tumors. Scale bar = 50 μm. E, H&E staining of organoids from WT prostate (left), ptenΔ/Δp53Δ/Δ GEMM (middle) and rb1Δ/Δp53Δ/Δ GEMM (right) prostate tumors, respectively. Scale bar =50 μm. F‐G, Coimmunofluorescent (IF) staining of AR and p63 (F), K8 and Syp (G) shows distinct lineage signatures of ptenΔ/Δp53Δ/Δ GEMM and rb1Δ/Δp53Δ/Δ GEMM PCa organoids
