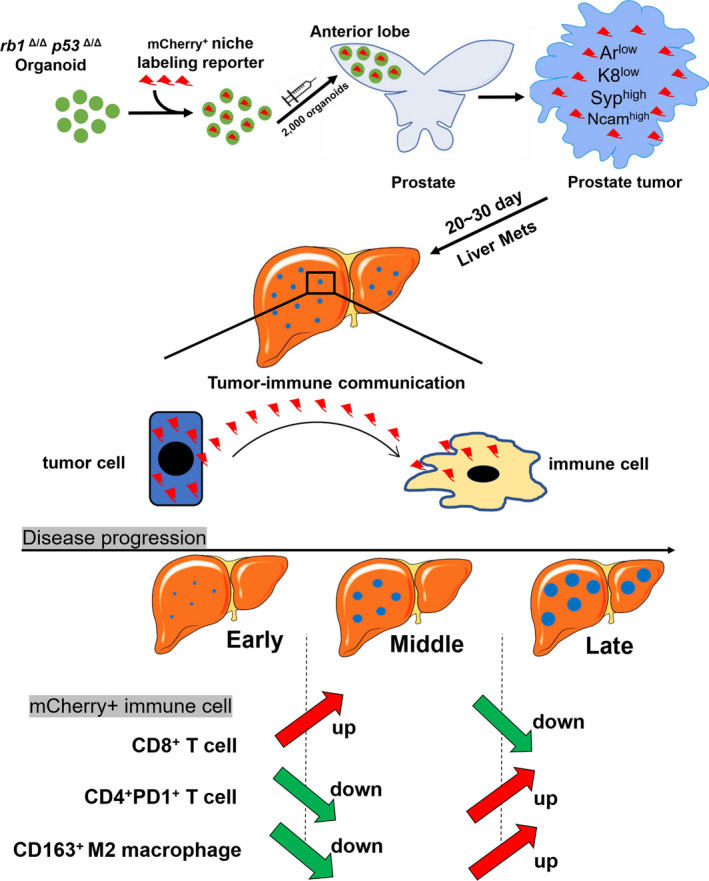
FIGURE 7.

Schematic graph of the dynamic tumor‐immune cell communication in the liver metastatic niche of the rb1Δ/Δp53Δ/Δ ODT mouse model. A, A schematic model showing a dynamic change of CD8+ mCherry+ T cells, PD1+ CD4+ mCherry+ T cells, and CD163+ M2 macrophages at the early, middle and late stages of liver metastasis in the rb1Δ/Δp53Δ/Δ ODT model
