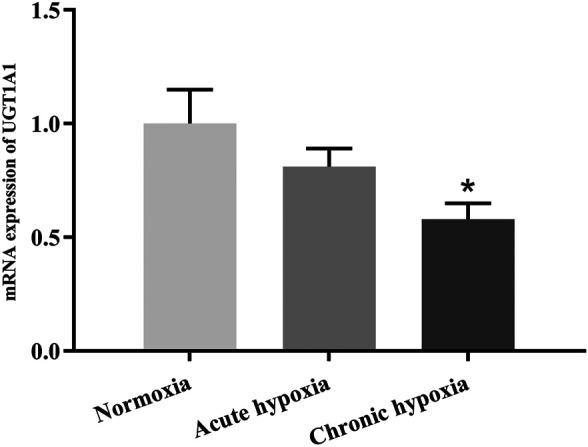
FIGURE 7.

The mRNA expression of UGT1A1 in rats after exposure to simulated high altitude hypoxia. The data are presented as mean ± SD. N = 6. The data were analyzed using ANOVA, and the differences between the means of two groups were compared using LSD tests. *p < 0.05 compared to the normoxia group.
