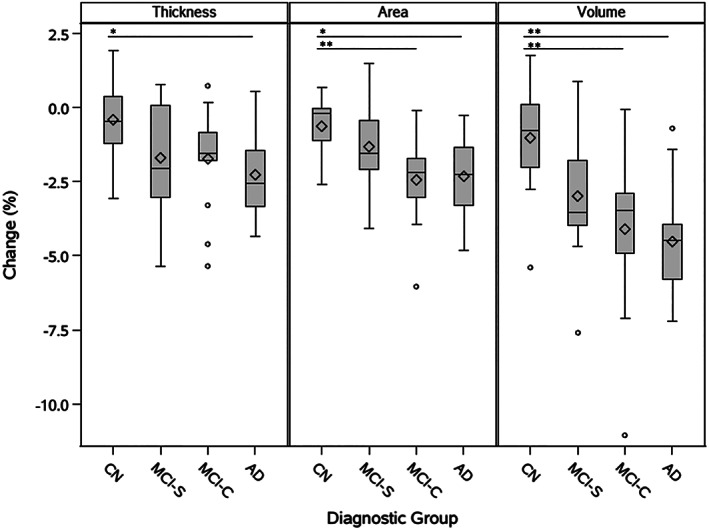
FIGURE 2.

Global loss in thickness, surface area, and volume by diagnostic group. Differences between diagnostic groups (CN, MCI‐S, MCI‐C, AD) were identified by ANOVA. Significant differences with .01 ≤ p < .05 are identified with the symbol *. Very significant differences with p < .01 are identified with the symbol **. Diamond symbols indicate group means. Lower and upper box edges represent the first quartile (Q1) and third quartile (Q3), respectively, with the area within the box representing the interquartile range (IQR). Horizontal lines inside of boxes represent group medians. Whiskers extend to the minimum and maximum nonoutlier values, where outliers are defined as falling below a minimum value of (Q1 – 1.5*IQR) or above a maximum value of (Q3 + 1.5*IQR). Outliers are indicated with circles
