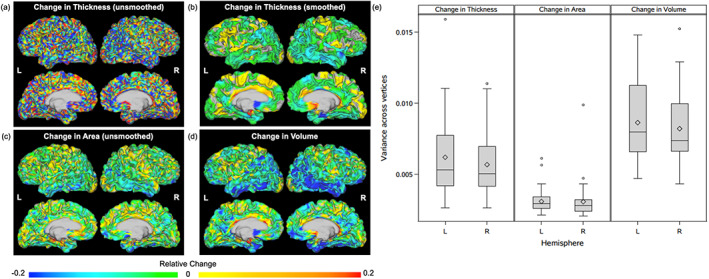
FIGURE 3.

Change in unsmoothed thickness, smoothed thickness, surface area, and volume within individual subjects. Relative change in (a) unsmoothed thickness, (b) smoothed thickness, (c) surface area, and (d) volume for a single subject in the AD group. Change in volume is calculated using smoothed thickness and unsmoothed surface area maps. Panel (e) demonstrates intrasubject variance in smoothed thickness (left), surface area (middle), and volume (right) change across all 50 study subjects. Results are demonstrated for the left (L) and right (R) hemispheres. Diamond symbols indicate group means. Lower and upper box edges represent the first quartile (Q1) and third quartile (Q3), respectively, with the area within the box representing the interquartile range (IQR). Horizontal lines inside of boxes represent group medians. Whiskers extend to the minimum and maximum nonoutlier values, where outliers are defined as falling below a minimum value of (Q1 − 1.5*IQR) or above a maximum value of (Q3 + 1.5*IQR). Outliers are indicated with circles
