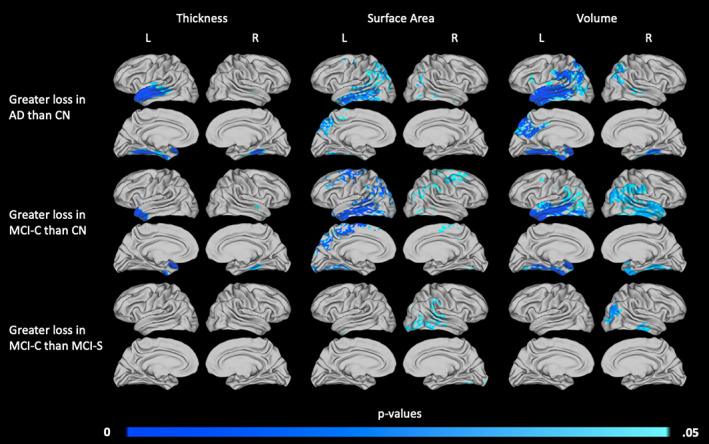
FIGURE 5.

Areas of increased 2‐year atrophy in the AD and MCI‐C diagnostic groups relative to the CN and MCI‐S groups. Diagnostic groups were compared to identify differences in patterns of atrophy, and significant differences were found between AD and CN groups (top row), MCI‐C and CN groups (middle row), and MCI‐C and MCI‐S groups (bottom row). Areas in which thickness (left column), surface area (middle column), or volume (right column) loss differ are shown. p values are threshold‐free cluster‐enhanced with family‐wise error correction
