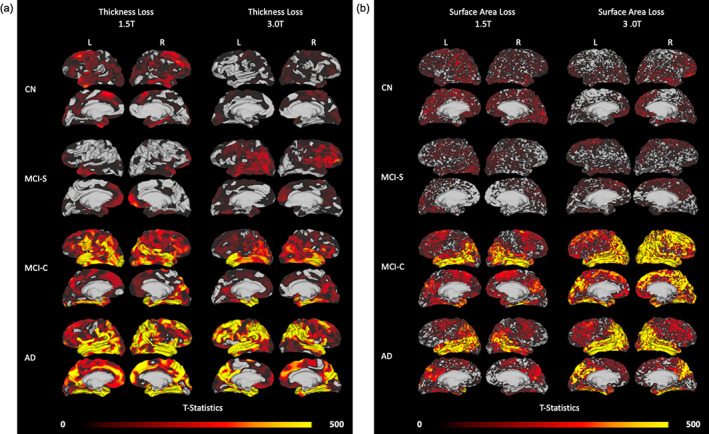
FIGURE 8.

Areas of atrophy over a 2‐year period assessed in the same subjects with 1.5 and 3.0 T MRI. (a) Patterns of thickness loss in CN (n = 11), MCI‐S (n = 9), MCI‐C (n = 12), and AD (n = 12) groups. (b) Patterns of surface area loss in the same groups of subjects. Each panel displays atrophy patterns that were derived from 1.5 T MRI scans (left column) and 3.0 T scans (right column) of the same subjects over the same 2‐year period. T‐statistics are threshold‐free cluster enhanced
