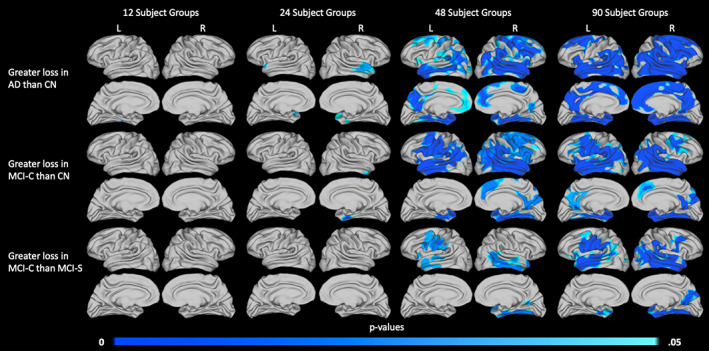
FIGURE 10.

Influence of sample size on the detection of thickness loss. Significant differences in 2‐year atrophy between the AD and CN groups (top row), MCI‐C and CN groups (middle row), and MCI‐C and MCI‐S groups (bottom row) are displayed. Results are shown for 12 subjects per diagnostic group (column 1), 24 subjects per diagnostic group (column 2), 48 subjects per diagnostic group (column 3), and 90 subjects per diagnostic group (column 4). All subjects were scanned at 1.5 T. p values are threshold‐free clusterenhanced with family‐wise error correction
