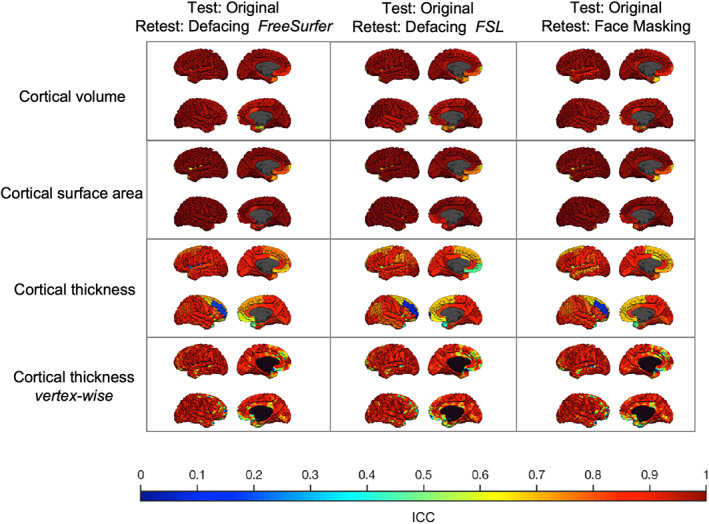
FIGURE 7.

Test–retest reliability in young adults de‐identifying only the second scan. The test–retest ICC for each type of brain measure is plotted on the average adult scan. Each column shows the test–retest reliability of the original scan compared to a de‐identified second scan using different techniques. Within each square, the left hemisphere (top) and the right hemisphere (bottom) are shown from an outer and medial view
