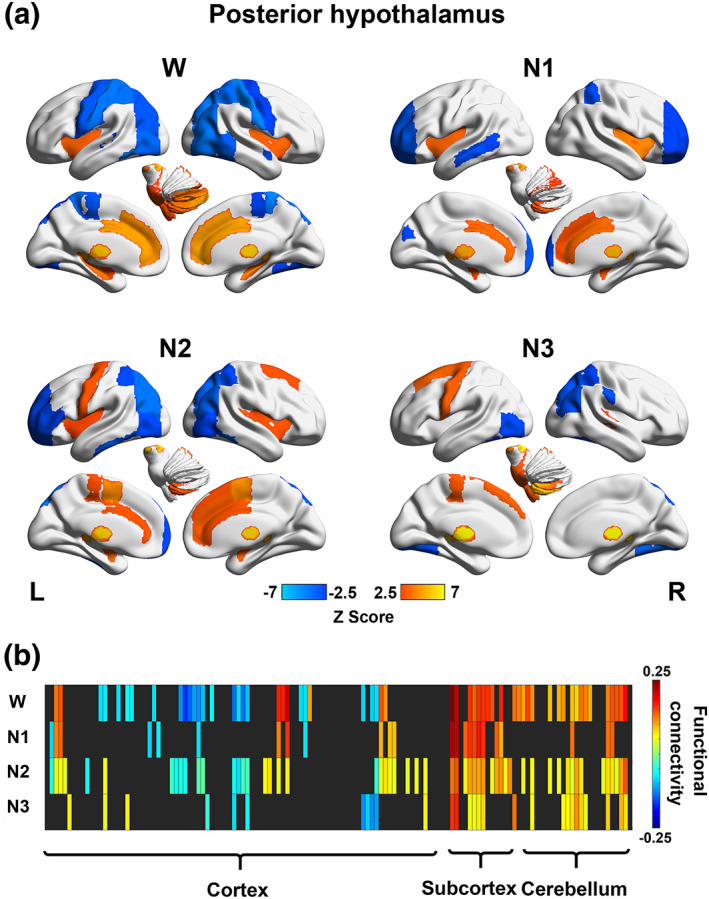
FIGURE 2.

Stage‐dependent functional network maps and matrix (showing connectivity between the posterior hypothalamus and 132 brain regions) during wakefulness (W), N1, N2, and N3 for the posterior hypothalamus. (a) Functional network maps (statistical Z scores) constructed during each stage with a threshold |Z score| > 2.5. (b) Functional connectivity matrix showing significant connections (with a threshold FDR‐corrected p < .05) during wakefulness (W) and sleep (N1, N2, and N3). Nonsignificant correlations were left black. Brain regions 1–132 according to the number in the atlas included in the Conn toolbox were arranged from left to right
