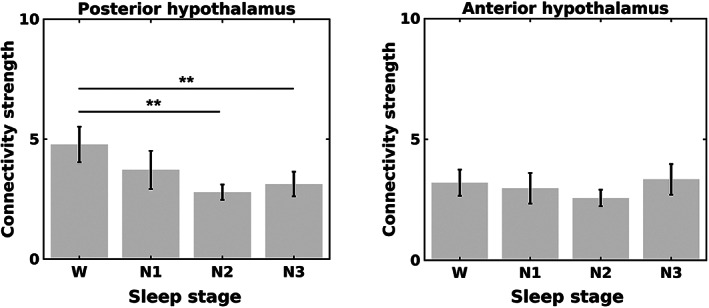
FIGURE 4.

Connectivity strength of the posterior hypothalamus (left panel) and anterior hypothalamus (right panel) during wakefulness (W) and nonrapid eye movement (NREM) sleep (N1, N2, and N3). The connectivity strength was calculated based on a threshold Bonferroni‐corrected p < .00001. The error bars represent SEs. *p < .05, **p < .01, and ***p < .001
