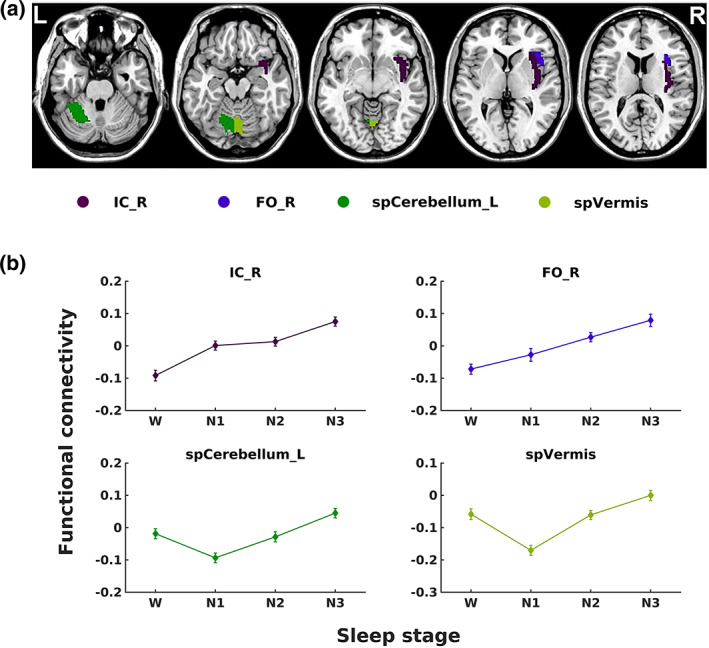
FIGURE 6.

The locations and functional connectivity of the brain regions show a significant effect of the stage on anterior hypothalamic connectivity. (a) Axial views (Z = ‐27, ‐17, ‐7, 3 and 13, from left to right) of the brain regions displaying a main effect of the stage presented in Table 2. (b) Functional connectivity (average Fisher‐z scores) between the four brain regions shown in (a) (L, left; R, right) and anterior hypothalamus. The error bars represent SEs
