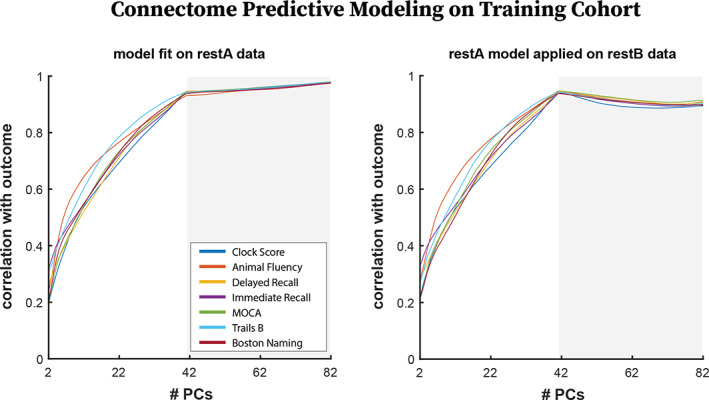
FIGURE 5.

For all plots, restA Training functional connectomes (FCs) were used for edge selection and model fitting. (left) Correlation between estimated and expected outcomes from models fit using restA FCs. (right) Correlation between estimated and expected outcomes when models fit on restA Training FCs were applied to restB FCs from the same subjects
