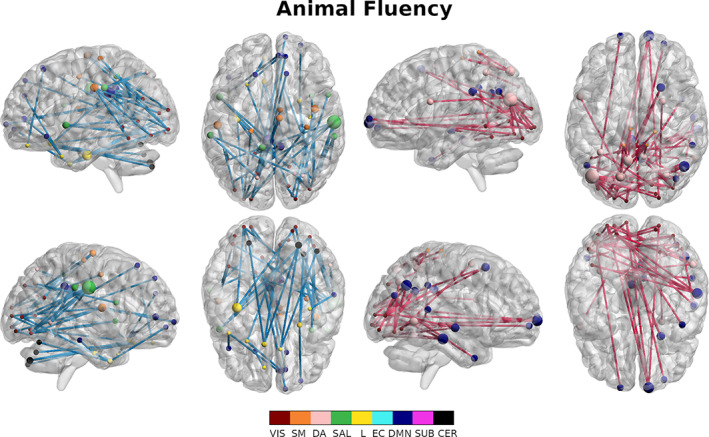
FIGURE 7.

Overrepresented edges (binomial test, α = .01) for the animal fluency test. Positively associated edges (left) and negatively associated edges (right) are visualized separately. Nodes are sized according to their degree and colored according to resting state network membership. Positive mask edges are colored blue while negative mask edges are colored red
