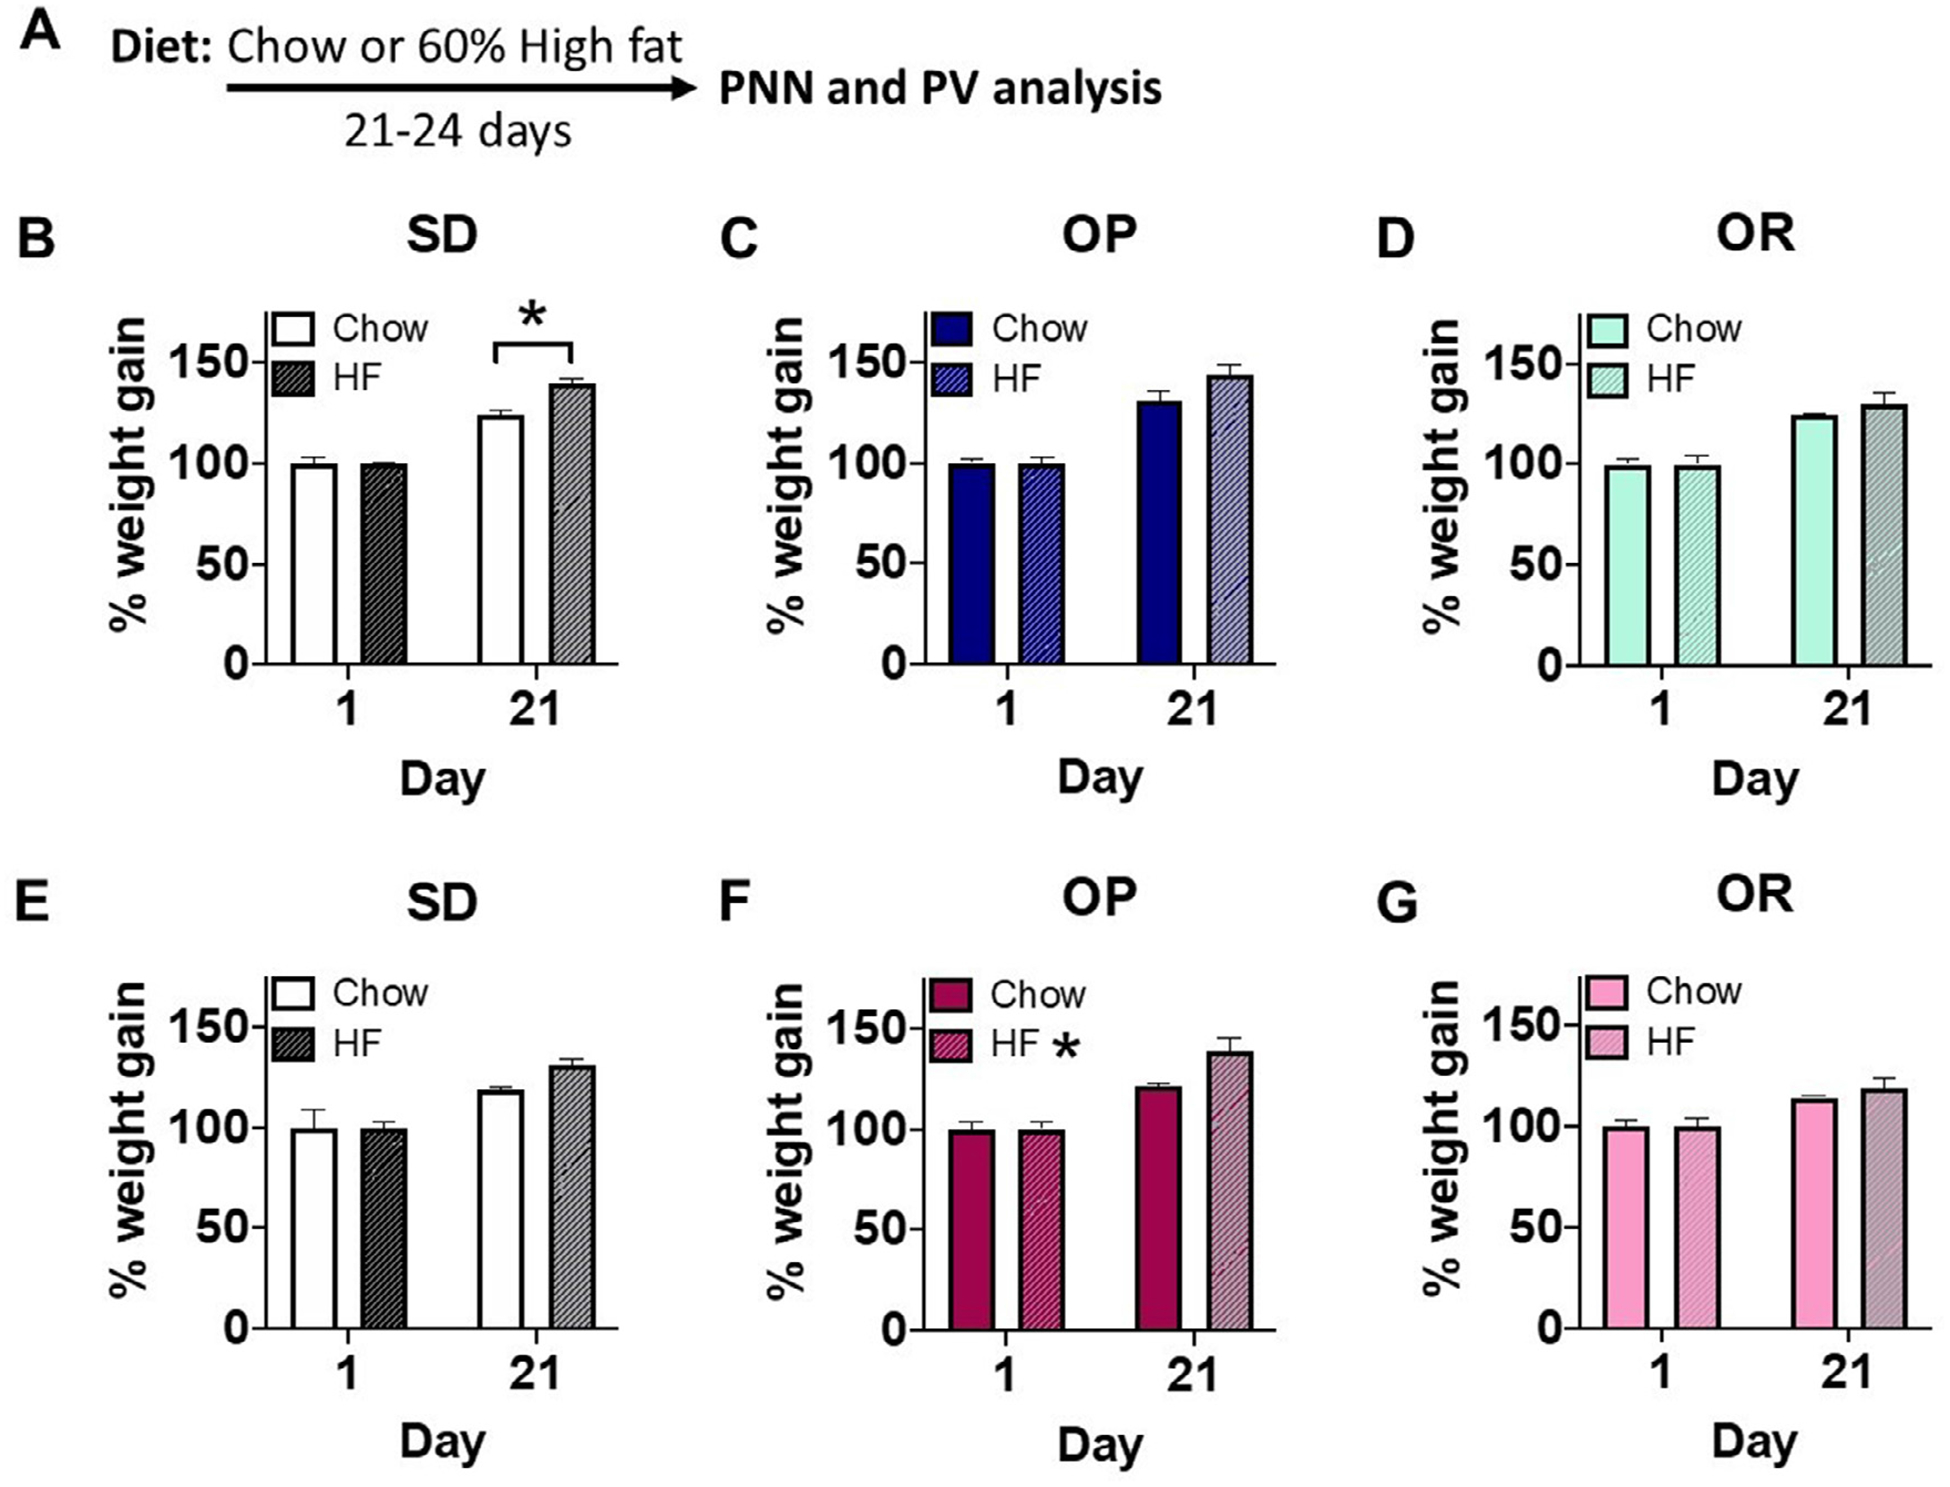
Figure 1.

Dietary manipulation. A. Experimental timeline. Male and female rats of Sprague-Dawley (SD) and selectively bred obesity-prone (OP) and obesity-resistant (OR) strains were maintained on chow or high-fat (HF) for 21–24 days after which tissue was collected for analysis. B-D. Male weight gain, expressed as percent increase within animals from day 1 (D1) to D21 of dietary manipulation among SD, OP, and OR fed chow (left; white, dark blue, and light blue bars, respectively) and SD, OP, OR males fed HF (right; dashed white, dashed dark blue, and dashed light blue bars, respectively). E-G. Female weight gain among SD, OP, and OR fed chow (left; white, dark pink, and light pink bars, respectively) and SD, OP, OR females fed HF (right; dashed white, dashed dark pink, and dashed light pink bars, respectively). Values represent the mean ± S.E.M. (*p<0.05).
