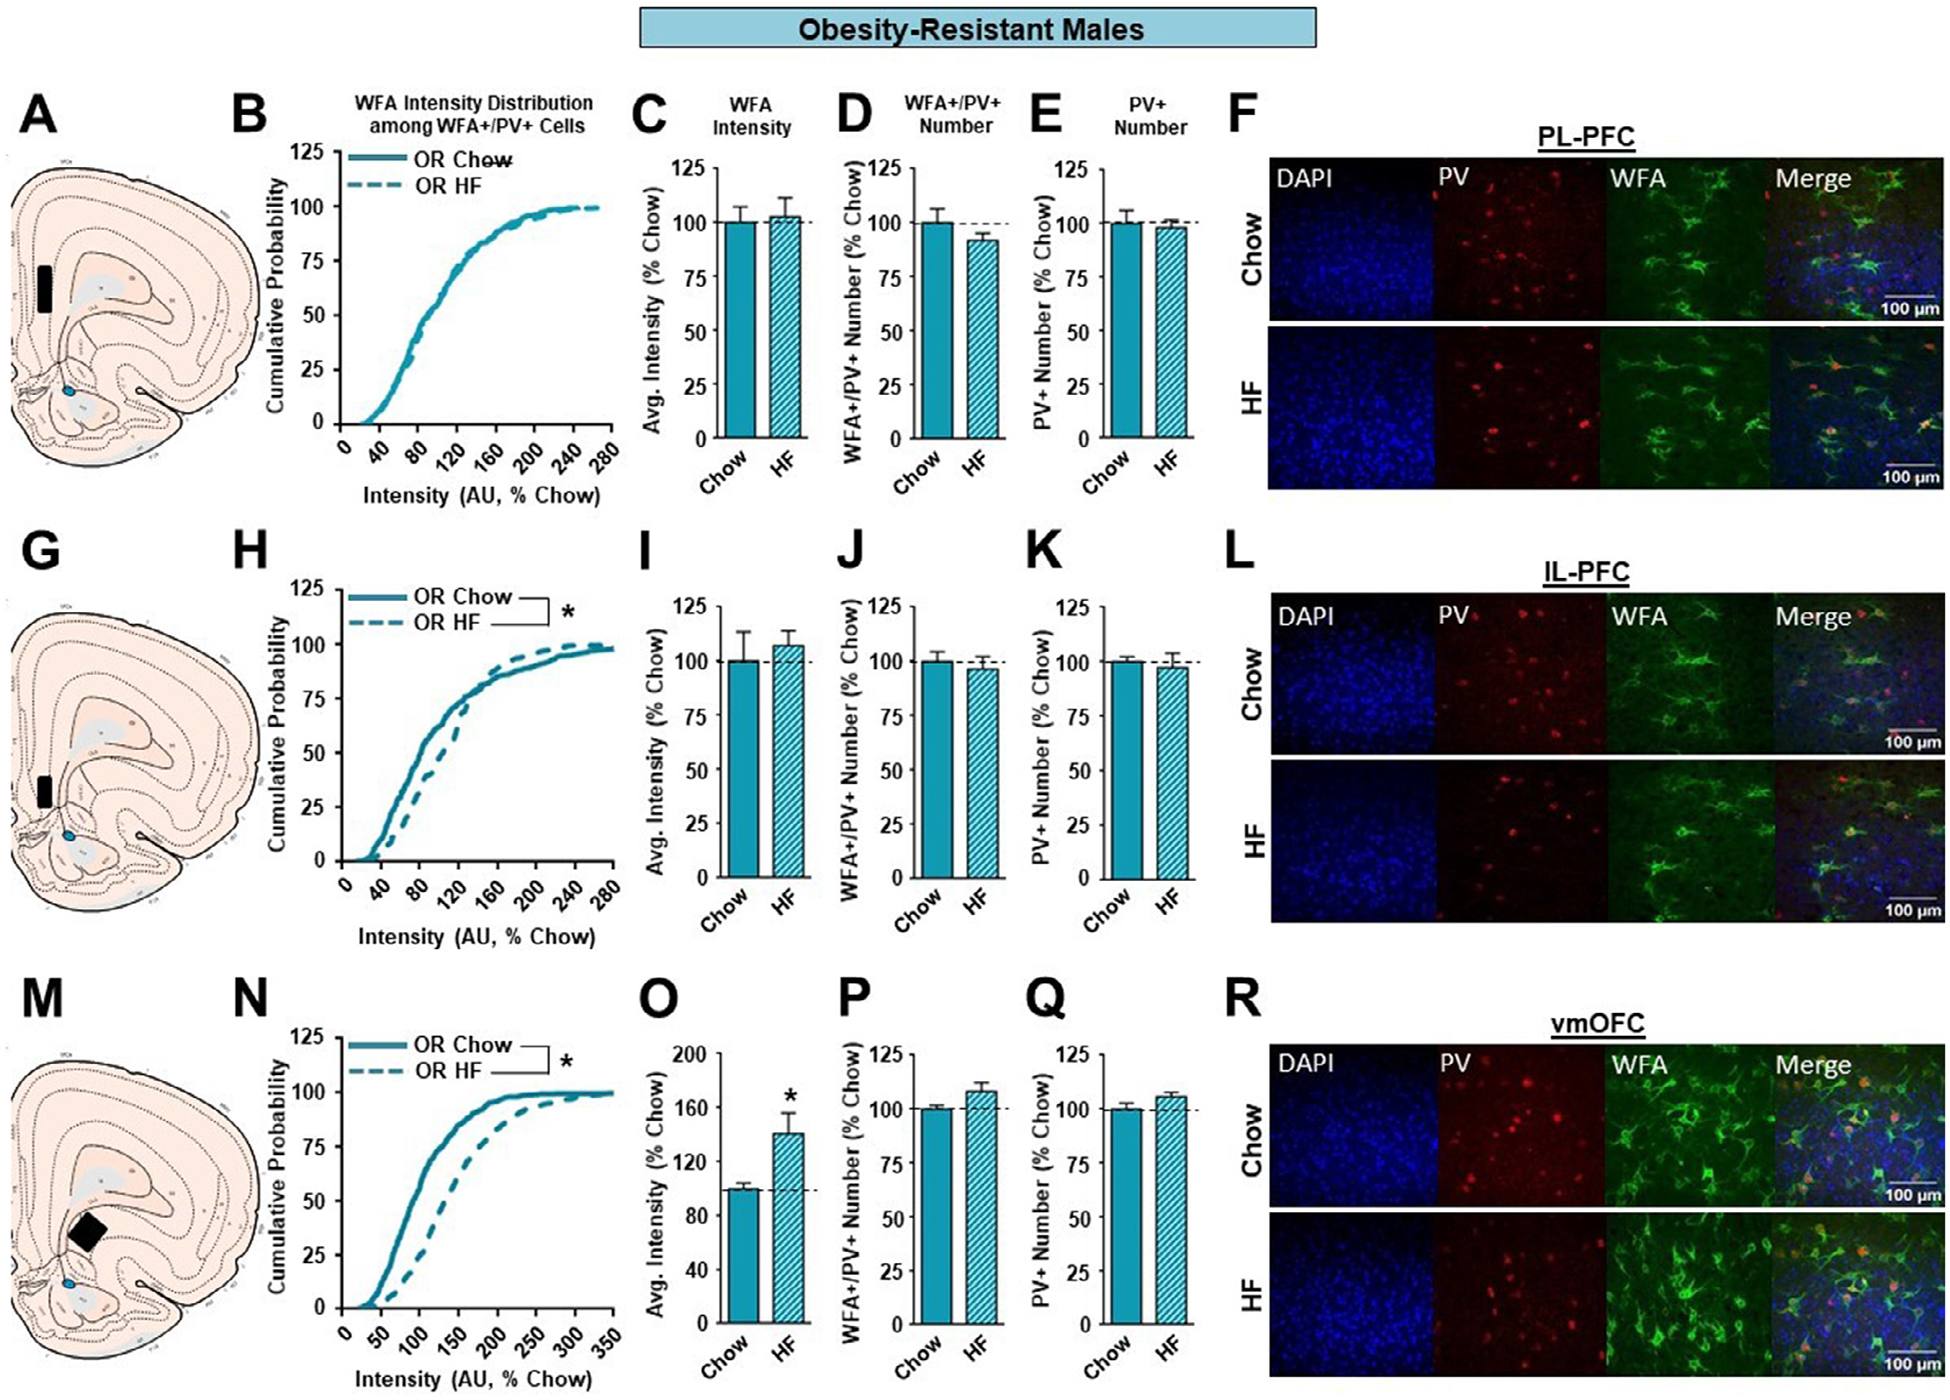
Figure 4.

The effects of a HF diet on structural plasticity of PV-containing cells in the prefrontal cortex of male OR rats. A. Schematic of region analyzed. B. PNN intensity expressed as a cumulative probability for chow (light blue solid line) and HF (light blue dotted line) fed rats in the PL-PFC. C. Average PNN intensity among chow (light blue bar) and HF (light blue dashed bar) fed groups in the PL-PFC. D. PNN number among chow and HF fed groups. E. Number of PV-containing cells in the PL-PFC. F. Representative images from the PL-PFC. G. Schematic of region analyzed. H. PNN intensity expressed as a cumulative probability for chow and HF fed rats in the IL-PFC. I. Average PNN intensity among chow and HF fed groups in the IL-PFC. J. PNN number among chow and HF fed groups. K. Number of PV-containing cells in the IL-PFC. L. Representative images from the IL-PFC. M. Schematic of region analyzed. N. PNN intensity expressed as a cumulative probability for chow and HF fed rats in the vmOFC. O. Average PNN intensity among chow and HF fed groups in the vmOFC. P. PNN number intensity among chow and HF fed groups. Q. Number of PV-containing cells in the vmOFC. R. Representative images from the vmOFC. Values represent the mean ± S.E.M. (*p<0.05).
