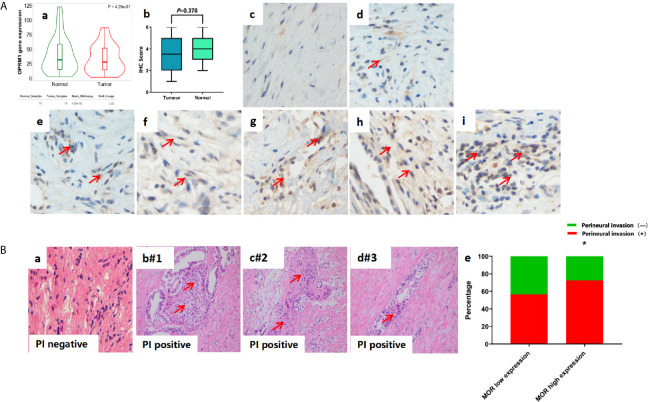
Figure 2.
(A) Representative image of IHC sample to describe scoring and MOR expression. All images are magnitude 400. (a) OPRM1 gene expression in PDAC tumour tissue and adjacent non-tumour tissue; (b) MOR expression in PDAC tumour tissue and adjacent non-tumour tissue; (c) score 0; (d) score 1; (e) score 2; (f) score 3; (g) score 4; (h) score 5; (i) score 6. (B) Representative image of HE staining sample to describe Perineural invasion (PI). (a) PI negative. (b-d) PI positive patients (#1-3). (e) PI positive according to MOR expression. *P < 0.001.

