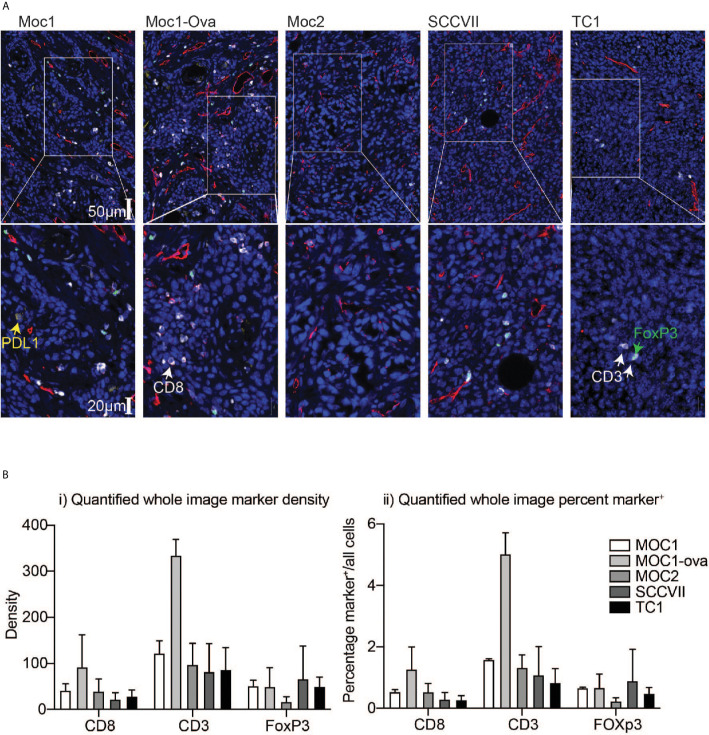
Figure 1.
Differential immune infiltration across murine HNSCC tumor models by immunohistology. Tumors were established in immune-competent animals and tumors were harvested for analysis of infiltrating immune cells by IHC. (A) Representative images following multiplex IHC for infiltrating immune cells in the tumor showing PDL1 (yellow), CD3 (white), CD8 (red), FoxP3 (green), DAPI, (blue). Lower images are higher magnification inset of upper images. Scale bars are shown. (B) Quantification of i) marker density and ii) percent marker positive across tumor models. Graphs show means and SD of two tumors per group.

