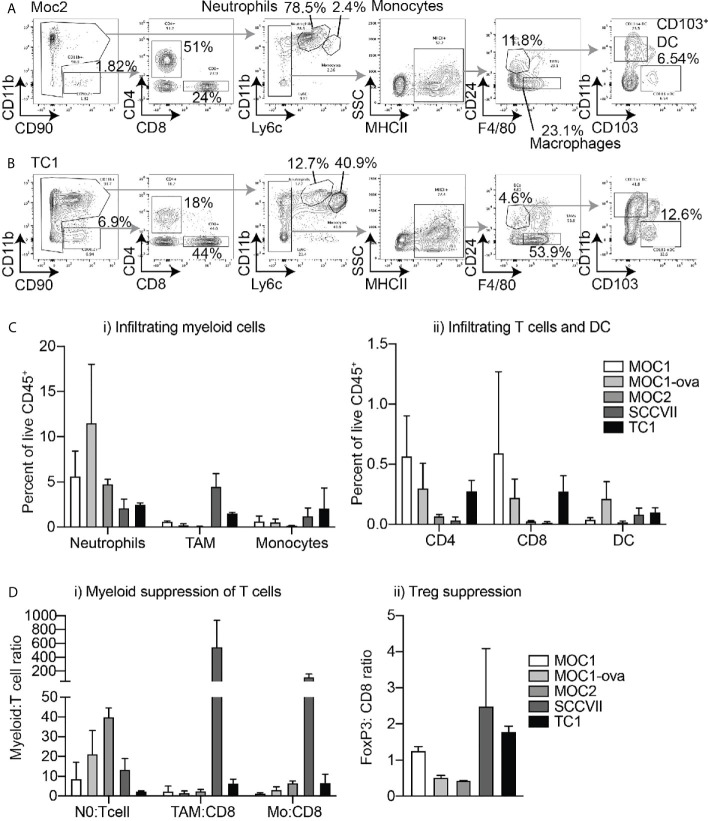
Figure 2.
Differential immune infiltration across murine HNSCC tumor models by flow cytometry. Tumors were established in immune-competent animals and tumors were harvested for analysis of infiltrating immune cells by flow cytometry. Representative flow cytometry of (A) Moc2 and (B) TC1 showing gating strategies to identify individual cell types in two contrasting tumors. Subgating is shown using gray arrows, key populations are identified. (C) Quantified flow cytometry across multiple tumors for key populations of i) myeloid cells and ii) T cells and DC. (D) Relative levels of immune cells from Figures 1 and 2 to show relative levels of i) myeloid cells and ii) Tregs to T cells to identify potential suppression patterns. 3-4 individual tumors per tumor type were analyzed.

