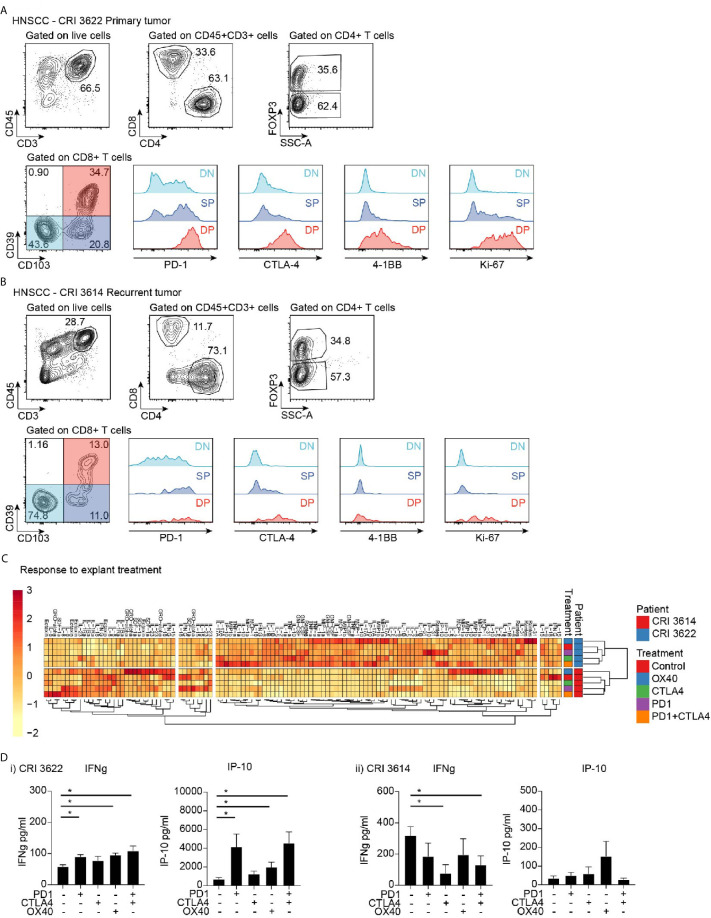
Figure 6.
Effect of immunotherapy treatment on cytokine and chemokine secretion from tumor explants. Flow cytometry analysis of infiltrating T cell populations in HNSCC patients with (A) primary tumor and (B) recurrent tumor. Gating identifies CD4 and CD8 T cell infiltrate, as well as FoxP3+ Treg cells, and evaluates critical functional markers on the different CD8 T cell populations identified by CD39 and CD103 expression. (C) Cytokine and chemokine secretion from tumor explants from patients in (A, B) treated with candidate immunotherapies. Responses are clustered to identify potential coregulated differences. Rows are centered; unit variance scaling is applied to rows. Imputation is used for missing value estimation. Both rows and columns are clustered using correlation distance and average linkage. 120 rows, 8 columns. (D) Explant production of IFNg and IP10 in i) primary tumor and ii) recurrent tumor. Key: NS, not significant. *p < 0.05.

